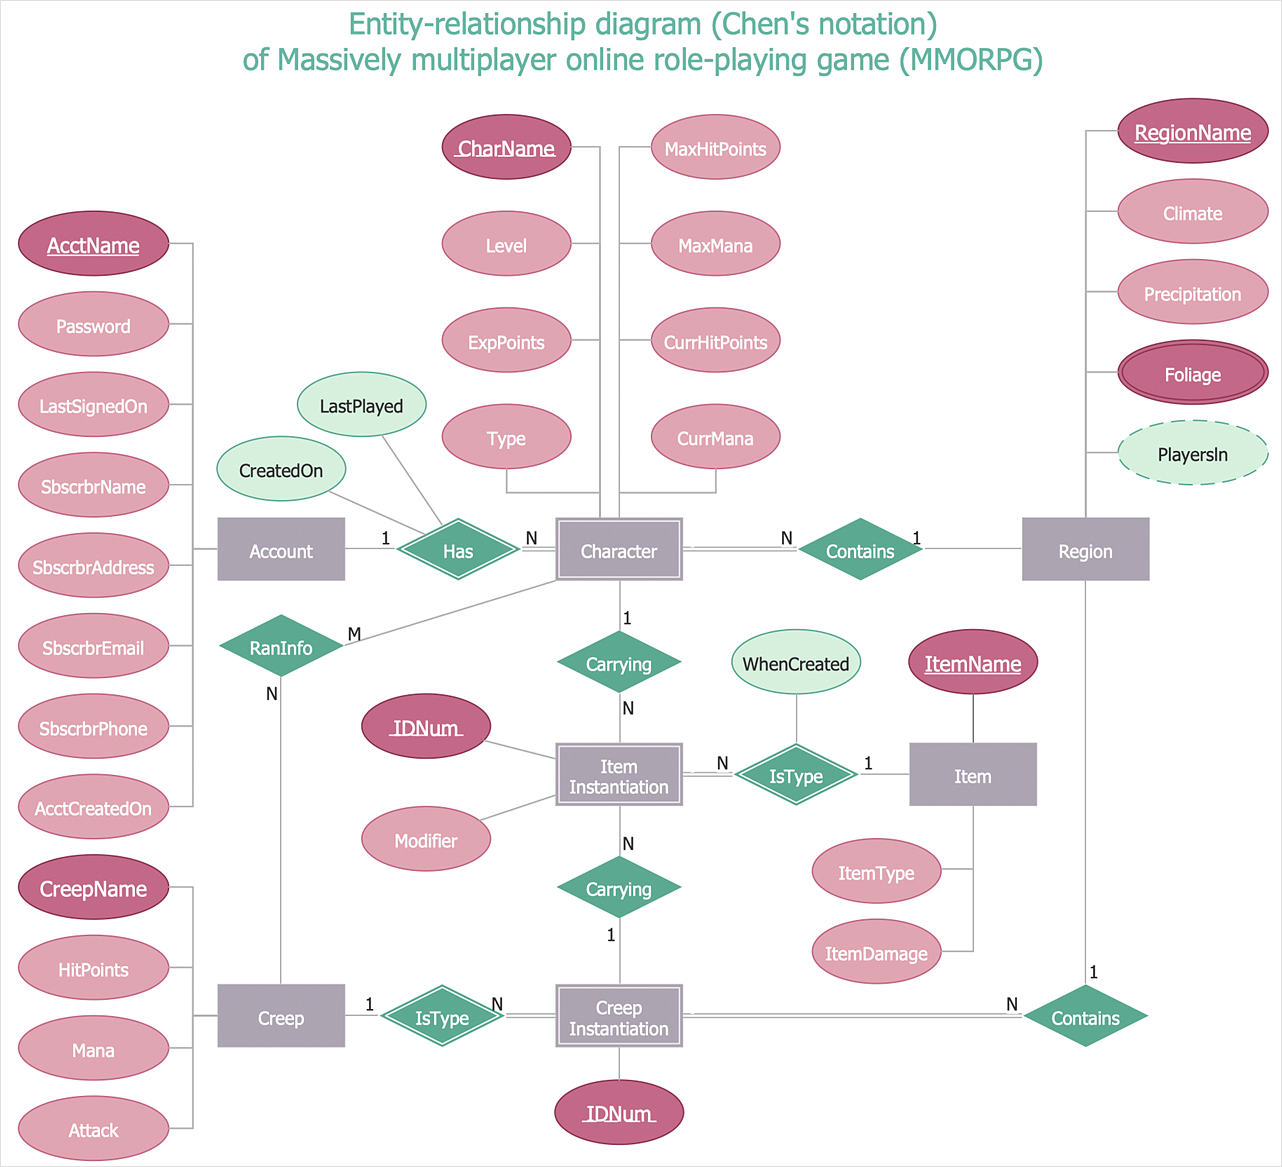
An ERD (Entity Relationship Diagram) is a visual representation of different data using conventions that describe how these data are related to one another. It is made up of an entity (noun), attribute (adjective), and relationship (verb). A rectangle symbolizes an entity, an oval symbolizes an attribute, and a diamond represents a relationship. There are two different notations for ERD’s: Chen’s Database Notation and Crow’s Foot Database Notation. The main difference between these ERD’s is that Chen database notation uses a diamond and connecting lines with symbols to describe relationship and cardinality, while Crow’s Foot database notation just uses lines with symbols on the end. Cardinality is essential for showing the numerical relationship between entities. Cardinality also describes a fundamental relationship between two entities or objects. There are three relationship types or cardinalities: one-to-one, one-to-many, and many-to-many. These cardinality are differentiated by different symbols. Entity-Relationship (ER) diagrams are used to describe the cardinality in databases. The relationship’s within Crow’s foot notation is a straight line connecting multiplicity of one and a mandatory relationship. The key idea behind a ERD is to help to identify different system elements and their relationships with each other. Another aspect that I previously described in Week 2 is Salesforce. Salesforce is a cloud-based software company that provides customer relationship management software and applications. Within Salesforce, there are dynamic dashboards. Dynamic dashboards enable each user to see the data they have access to. With a dynamic dashboard, you can control data visibility without having to create a separate dashboard, with its own running user and folder, for each level of data access(Salesforce.com).


Leave a Reply
You must be logged in to post a comment.