

Fall 2015 Temple Data Analytics Challenge Infographic
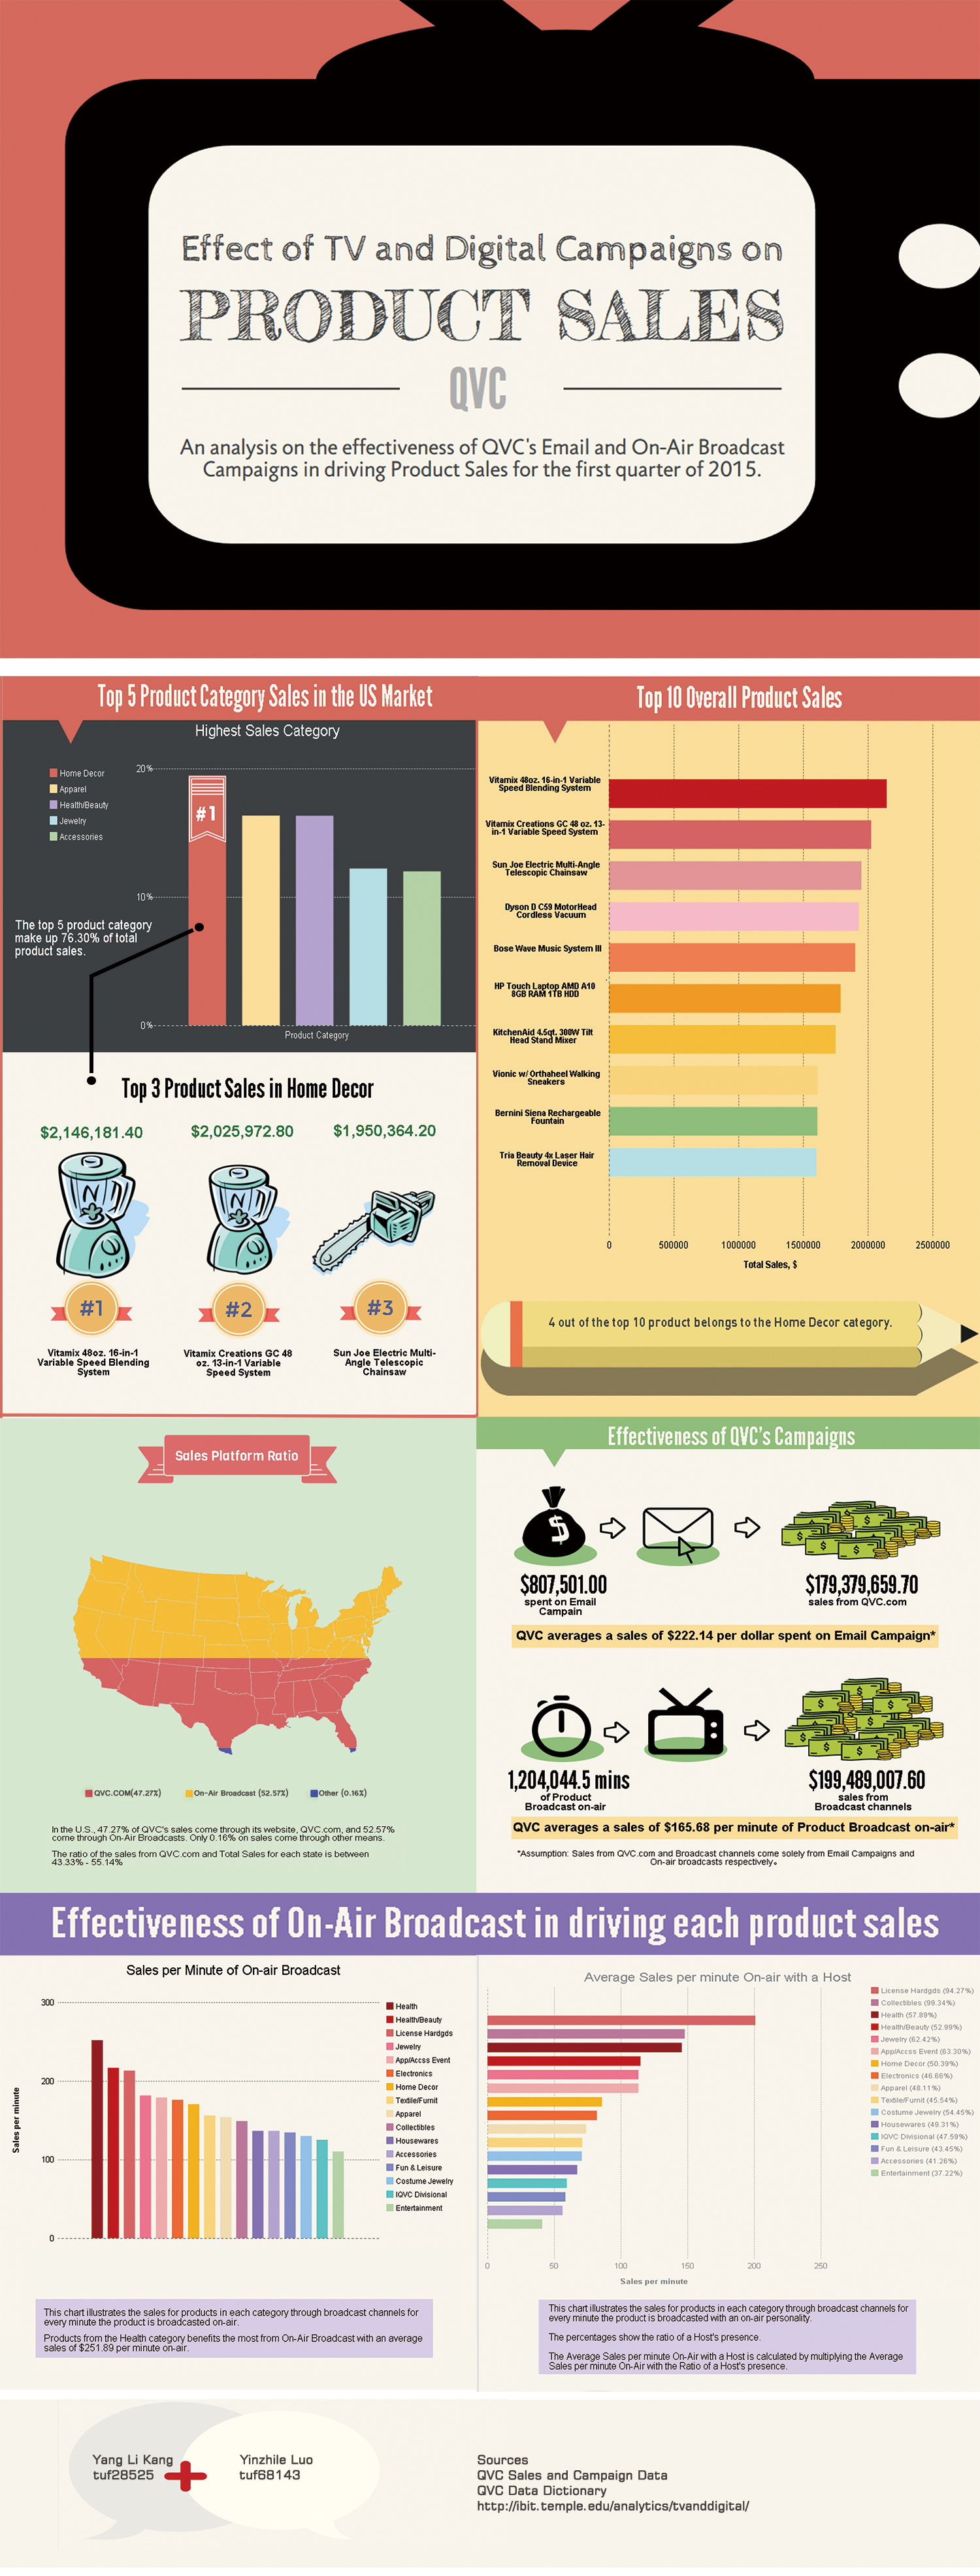
The infographic of the analysis my group conducted on QVC’s 2015 sales data which we submitted for Temple’s Data Analytics Challenge 2015 where we received honorable mentions (4th-10th place) out of the 400 participants.
The Power Point presentation we used to present our infographic to a panel of judges consisting of senior directors from multiples companies.
Data Analytics Challenge Presentation