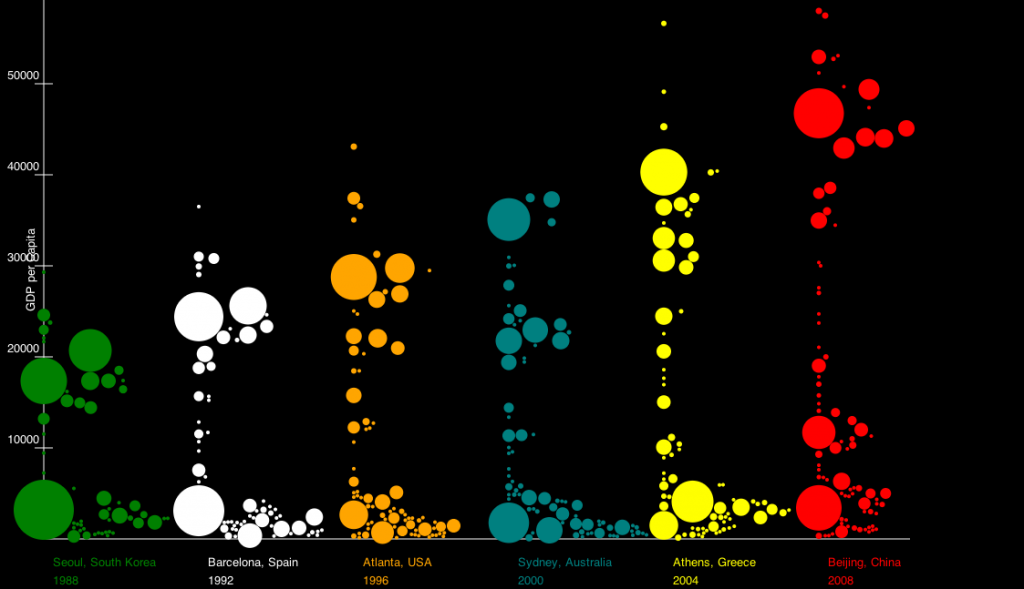
Data Visualization Analysis
Data visualization is the use of images to represent information through the form of analytics. It not only provides a powerful means to make sense of data, it also helps communicate what we have discovered to others. Visual analysis software which has become widely used, allows us to represent data graphically as well as be able to interact with visual representations to filter out what is and what is not relevant. Because of this, data visualization has become very popular and highly appreciated for the benefits that it can bring to businesses. From the earliest table created in the 2nd century in Egypt to organize astronomical information as a tool for navigation, data visualization has come as far as producing static graphs that can be delivered on paper or electronically on the computer to help us communicate important information in an efficient way (Few 2-4)
Data analytics in its own is the science of observing raw data in order to analyze information. Data visualization is simply a tool in order to fulfill just that. It also relates to and builds upon other topics in data analytics that provide many benefits as well. For instance, data mining is similar in the fact that it is used to analyze large quantities of data in order to discover meaningful patterns (Grinstein & Thuraisingham).You can easily apply data visualization to mining in order to extract information from databases. Both seem to complement each other very well. One could even argue that it may be essential to apply data visualization techniques to data mining once it matures (Grinstein & Thuraisingham).

Data visualization is so important that many research teams such as the Georgia Tech research Institute have developed software tools that use data analysis and data visualization in order to communicate data. In the case study “Picture Worth a Thousand Numbers: New Data Visualization Tool Helps Find the ‘Unknown Unknowns,’” Edward Clarkson, a research scientist at Georgia Tech stated that data visualization allows users to pose data-related questions and discover the answers with more ease when compared to regular table formats. The institute was able to develop (TMT) Test Matrix Tool which is a multi-component system that is capable of designing, executing, and analyzing large-scale modeling and simulation data sets (Georgia Tech). With it, users are able to see query results instantly in the form of graphical images. The developers of this software stated that it had the capabilities of scrutinizing information gathered from disciplines such as statistics in the healthcare industry as well as the sports industry (Georgia Tech).
Data visualization has clear benefits, and while it is far away from being at its full potential, it is certainly making headway.
Works Cited
Few, Stephen. “Data Visualization: Past, Present & Future.” Perceptual Edge Articles. Cognos, 10 Jan. 2007. Web. 10 May 2013. <http://www.perceptualedge.com/articles/Whitepapers/Data_Visualization.pdf>.
Grinstein, George , and Bhavani Thuraisingham. “Data Mining and Data Visualization: Position Paper for the Second IEEE Workshop on Database Issues for Data Visualization .” UTD.edu. N.p., n.d. Web. 10 May 2013. <http://www.utd.edu/~bxt043000/Publications/Conference-Papers/DM/C168_Data_Mining_and_Data_Visualization.pdf>.
“Picture Worth a Thousand Numbers: New Data Visualization Tool Helps Find the “Unknown Unknowns†| Georgia Tech Research Institute.” Problem. Solved. | Georgia Tech Research Institute. Georgia Tech Institute, n.d. Web. 10 May 2013. <http://www.gtri.gatech.edu/casestudy/new-data-visualization-test-matrix-tool>.


