Customer Profiles
Privately Owned Theaters:
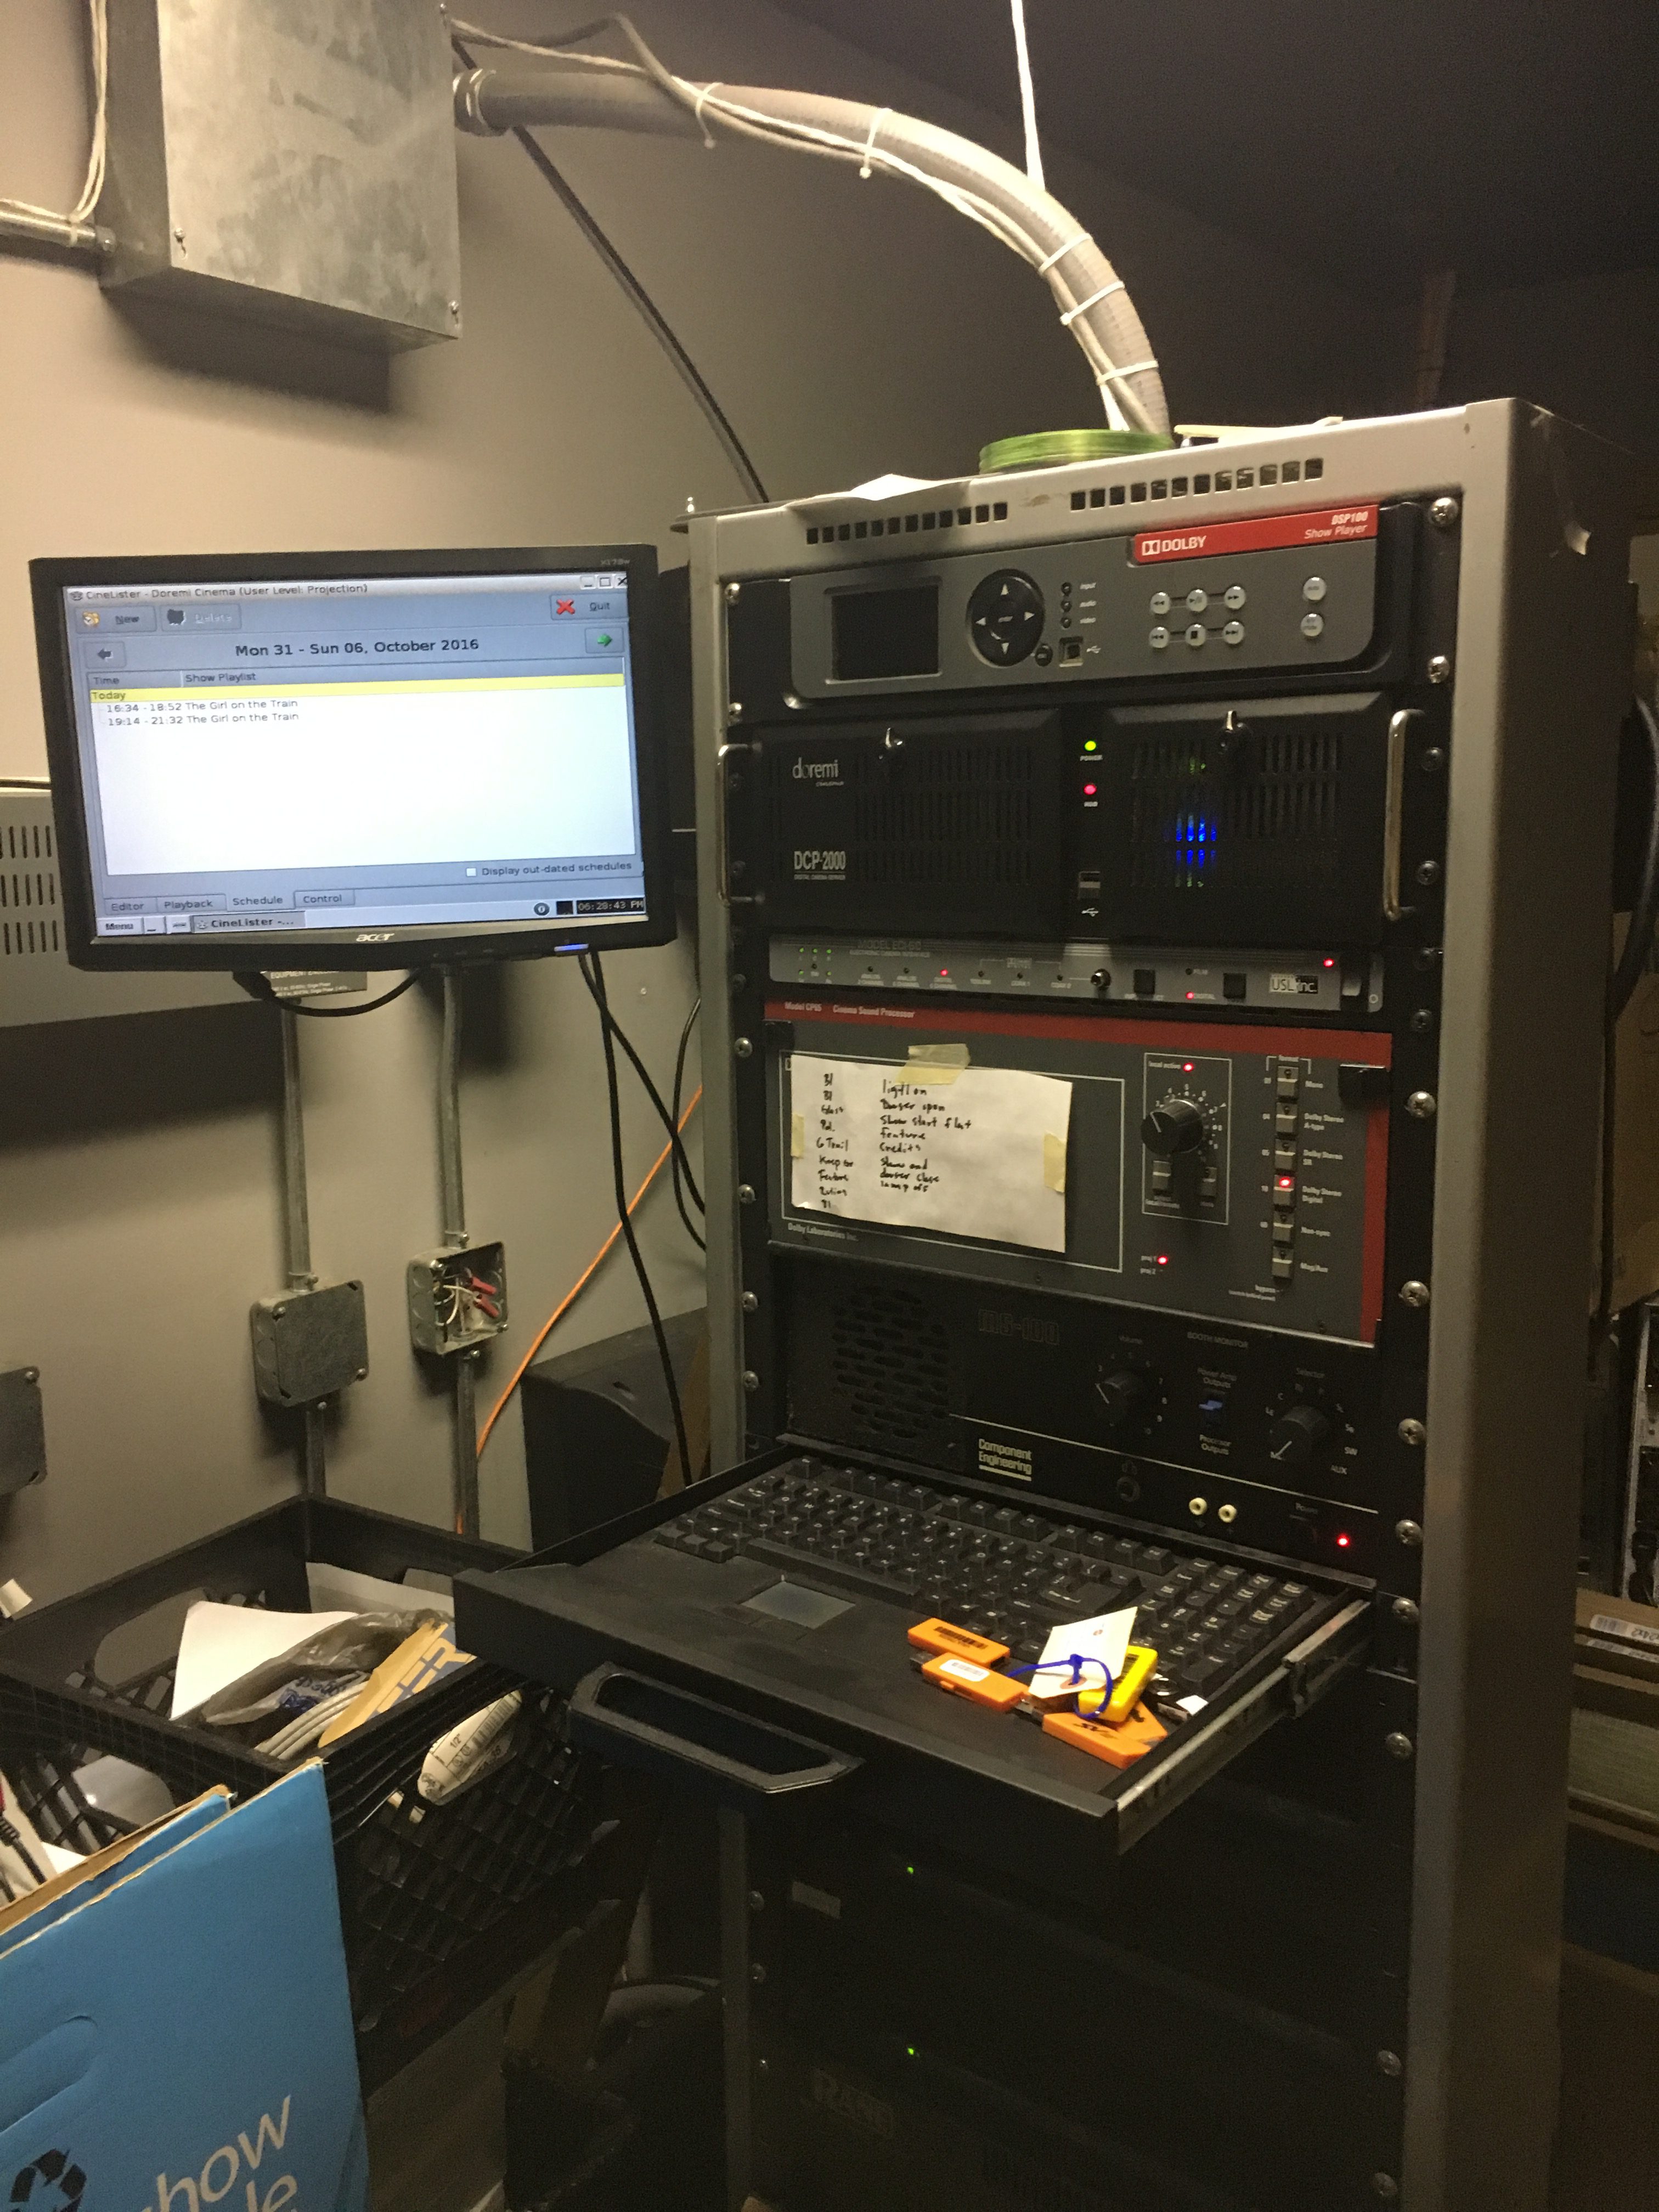
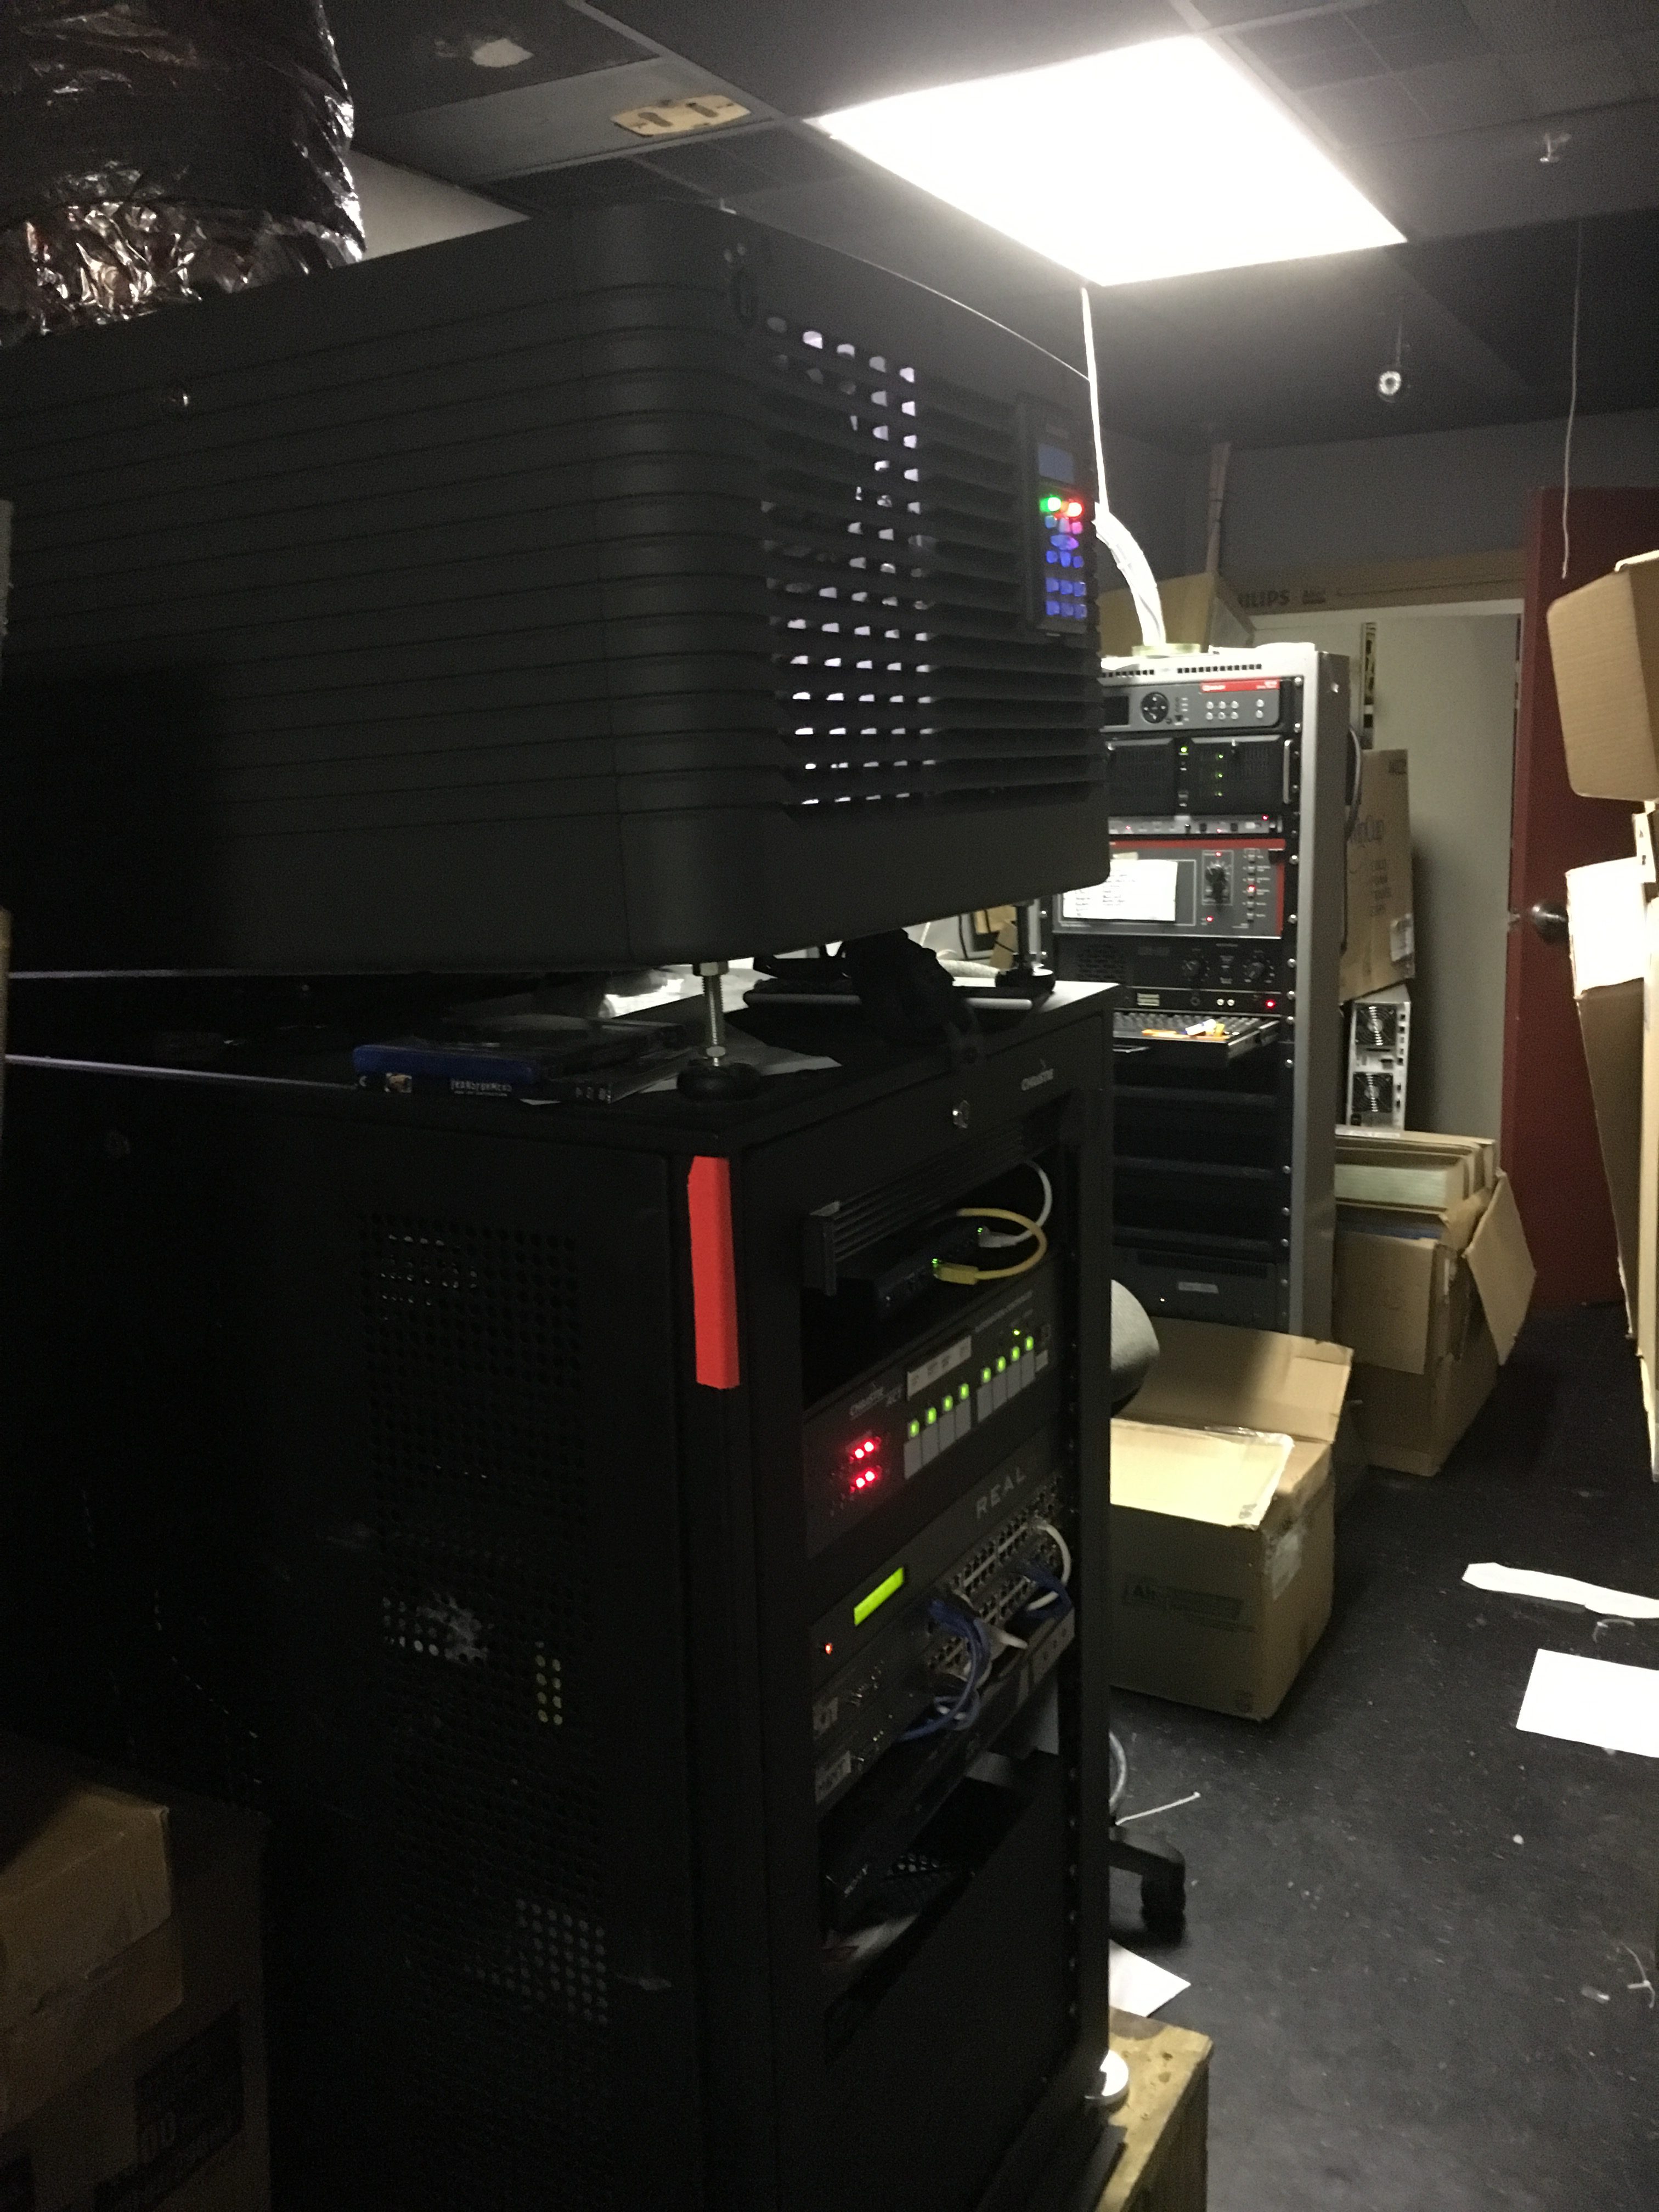
Existing Servers
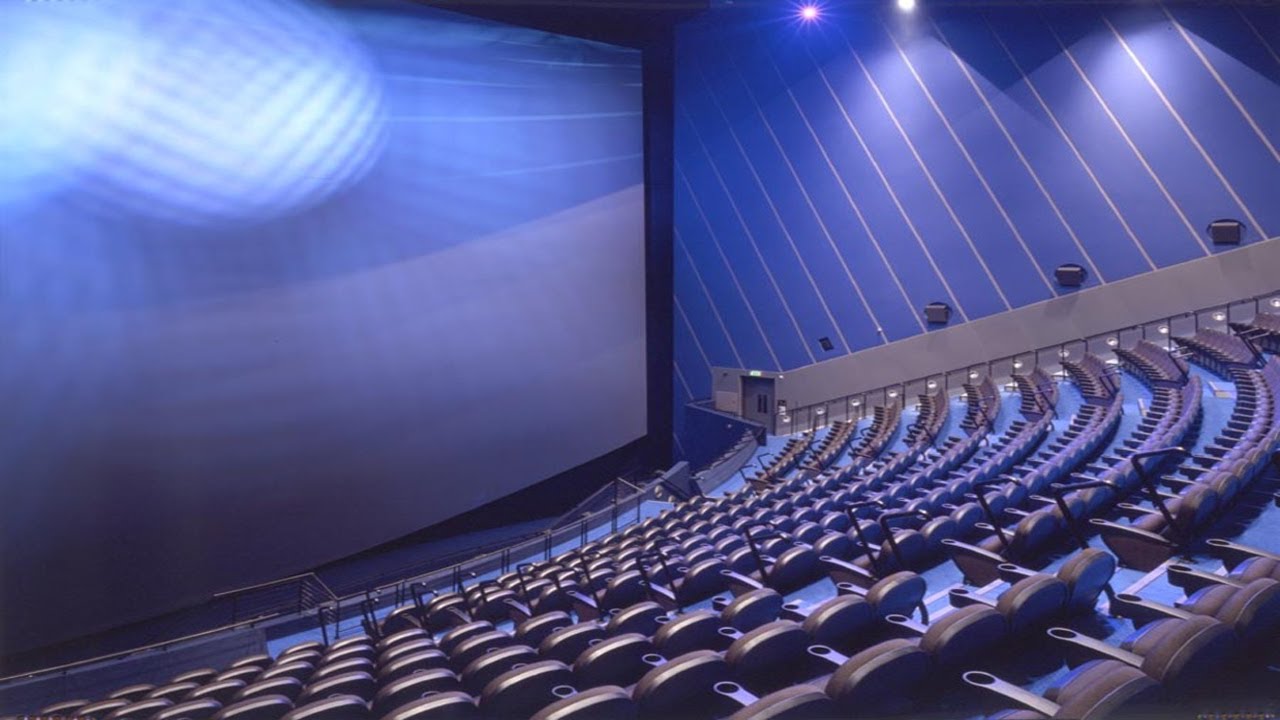
Current Projector
There are may unique challenges that come with a privately owned theater company. For one, many of the primary advertising platforms where consumers look up movie times and purchase tickets are owned by big box theaters.
Fandango, the primary search function for films, is owned by Regal and United Artist and prioritizes those big box theaters, making it easy for consumers to purchase tickets in their theaters. Smaller theaters must pay for private transaction systems built into their existing websites or outsource their tickets to a third party like movietickets.com which takes a percentage of each transaction. Not to mention the movie studios insist on taking 63% of the theater’s gross profits for licensing the films themselves.
Competing with the big box theaters also comes with its own unique set of hardware difficulties as many IMAX theaters, the most popular format of movie watching, are standardized and parts are easily attained, repaired or replaced. Each movie theater that is privately owned must budged, based on our research, anywhere from $1-2,000 for upkeep of their existing hardware alone – not to mention expensive upgrades to outdated servers which cost on average $10,000. Many theaters run off of single servers which are attached to one projector whereas more updated theaters are operating on LMS servers which connect all projectors to a central location.
It is also extremely difficult to compete with the larger IMAX theaters when it comes to the bulbs that project the films. Larger bulbs that facilitate the projection onto the massive screens in IMAX theaters are more expensive and have less run time, further proving it is not as cost effective for smaller theaters to compete in that space.
To compete with these big box theaters, privately owned companies have resorted to several marketing techniques: Groupon, Dealflicks, unassigned seating, and “Screen Vision”. Groupon has proven time and time again to be a money loser for these theaters that must honor the cost paid to the vendor long after the coupon has expired and frequently only find that they make back their money on concessions. Dealflicks is a separate revenue stream where the theater lists their unpurchased seats at a reduced price in order to fill seats that might not otherwise be purchased.
When it comes to advertising there is not a large list of providers to choose from –theaters can either choose to market based on existing trends, leaving seats unassigned where larger theaters have resorted to assigned seating, and advertising packages like “Screen Vision” which pay the theater a small price for screen time before each film based on the number of films played.
Outsourcing:
- Bulletin – Check into the Theater
- Pays Company to manage FB, website, local updates/events, etc.
Hardware:
- New Servers – 10k
- New Projector – 2013
- Bulbs 2k – 500-700/up to 1500
- The bigger the bulb the less the run-time
Earnings:
- 150-200k on average each
- $4000/day – busy
- $126/day – slow
- 63% to studio – take gross out of the movie
Online Ticket Sales:
- Regal/AMC own Fandango – Small theaters have a hard time competing
- MovieTickets.com – ReelCinemasPA.com
Marketing Techniques:
- Screen Vision – Technicolor advertisement package – local places
- Groupon’s – 2 Ticket’s Large Popcorn
- Dealflicks – sell unsold seats for discounted prices
- No assigned seats – Large theaters have assigned seating
Thin Months:
- August-October
- January-March
Big Box Theaters:
Big box theaters have their own challenges when it comes to providing a marketable end user experience to moviegoers who might be otherwise compelled to stay home and watch a variety of streaming services, i.e. Netflix, Hulu, Amazon Video.
Many theaters have tried to provide an experience that transcends the movie whether it is a dine-in experience, IMAX, or the less obvious and well known kinetic seats that provide an interactive five dimensional experience to the user (Lee, M.U.O.). The problem with these experiential theaters isn’t the desire to attend, so much as it is the lack of repeat attendance and the willingness to pay for the $15 list price of tickets plus the markup for that experience.
In spite of the popular projections portrayed by popular opinion, box office revenue is projected by PwC to grow to, “US $12.5 billion by 2018, from US $10.8 billion in 2013, at a 3.1 percent CAGR [compared to a total advertising CAGR of 3.7 percent],” (PwC US, PR Newswire). To further support the available and growing market that Cinema Standoff could address, PwC projects mobile video game advertising revenue, “is expected to reach US$1.63 billion in 2018 from US$921 million in 2013, at a CAGR of 12.1 percent,” (PwC US, PR Newswire).
Consumers are hungry for interactive theater experiences and interactive gameplay on larger screens. “The most coveted movie audience for years was the 18- to 24-year-old male, and now it’s getting harder to get them in the movie theater because they’re much more into gaming,” says theater analyst Paul Dergarabedian (PwC US, PR Newswire). The unique aspect of Cinema Standoff is it will not only be able to capitalize on the growing revenue of video game advertisements, but also the increase in box office revenue, both of which combined are expected to grow at a rate of 15.2% by 2018 (PwC US, PR Newswire).
Statistics provided by PwC US 2014:
- Video games advertising revenue will continue to grow at an impressive pace, which surpassed total PC games revenue in 2012, is expected to reach US$1.63 billion in 2018 from US$921 million in 2013, at a CAGR of 12.1 percent.
- Box office resilience underscores the continuing popularity of the cinematic experience. U.S. box office revenue will exceed revenue from physical home video in 2015 and grow over the forecast period to US$12.5 billion by 2018, from US$10.8 billion in 2013, at a 3.1 percent CAGR.
- Mobile video gaming continues to drive uninterrupted growth in the U.S. and is forecast to grow at a CAGR of 6.9 percent to reach US$1.84 billion in 2018, up from US$1.32 billion in 2013.
- Online video gaming is widening user participation and micro-transactions are boosting revenues. Online video gaming is forecast to grow at a CAGR of 7.4 percent to reach US$3.60 billion in 2018, up from US$2.51 billion in 2013.
- In the U.S., Internet access is expected to continue to outperform all other E&M segments, with double-digit gains of 11.4 percent CAGR expected. Internet advertising (9 percent CAGR), video games (6.2 percent CAGR), TV advertising (4.9 percent CAGR), out-of-home advertising (4.7 percent CAGR) and filmed entertainment (4.7 percent CAGR) are expected to grow more than 4 percent compounded annually.
Sources:
The Verge: Video streaming services could make more money than the US box office by 2017
NPR: Now In Theaters, Video Game Tournaments On The Really Big Screen
BGR: Netflix is starting to wound the movie industry where it hurts most
M.U.O: Cinema Is Dying: How Movie Theaters Can Ensure Their Survival