In-Class Exercises
In-Class Exercise – Day 39 – Aggregating Data
In-Class Exercise – Day 39 – Aggregating Data in Tableau.pdf
NCAA 2013-2014 Player Stats.xlsx
In-Class Exercise – Day 39 – answer sheet.docx
Canvas submission link – https://templeu.instructure.com/courses/30770/assignments/53320
The lecture on Dec 6 will be given by Aaron Cheng, our TA, as a guest lecturer. This exercise will be counted toward your final grade.
In-Class Exercise – Day 34 – Twitter Sentiment Analysis
In-Class Exercise – Day 32 – Simple Predictive Analytics
In-Class Exercise – Day 27-28 – Visualizing Network
In-Class Exercise – Day 27-28 – Visualizing Network.pdf
Flight Paths July 4-8 2016.xlsx
Flight Networks July 4 2016.xlsx
Capital Bikeshare Trips Apr 1 2016.xlsx
Canvas submission link for Nov 3 – https://templeu.instructure.com/courses/30770/assignments/47172
Canvas submission link for Nov 1 – https://templeu.instructure.com/courses/30770/assignments/46209
In-Class Exercise – Day 25-26 – Advanced Data Visualization
In-Class Exercise – Day 25-26 – Advanced Data Visualization.pdf
Canvas submission link for Oct 30 – https://templeu.instructure.com/courses/30770/assignments/45705
Canvas submission link for Oct 27 – https://templeu.instructure.com/courses/30770/assignments/44506
In-Class Exercise – Day 22-23 – Visualizing with Maps
In-Class Exercise – Day 22-23 – Visualizing with Maps.pdf
Canvas submission link for Oct 23 – https://templeu.instructure.com/courses/30770/assignments/44082
Canvas submission link for Oct 20 – https://templeu.instructure.com/courses/30770/assignments/43449
In-Class Exercise – Day 21 – Visualizing KPIs
In-Class Exercise – Day 20 – Creating Inforgraphics
In-Class Exercise – Day 18 – Data Cleasing
In-Class Exercise – Day 16 – Integrating Datasets
In-Class Exercise – Day 15 – Creating Interactive Dashboards
Misleading Graphs – Best Team
Anthony Mazza, Joe Arnold, Michael Granovskiy

This graph has a vertical axis that begins at 420 rather than zero. The lower bar is 445 and the larger bar is at 485. But The Times bar is shown as twice as big.

There isn’t a Y axis at all. 78% is depicted as twice as many books as 75%. The scale consistency is off and the number of books between percentages isn’t consistent.
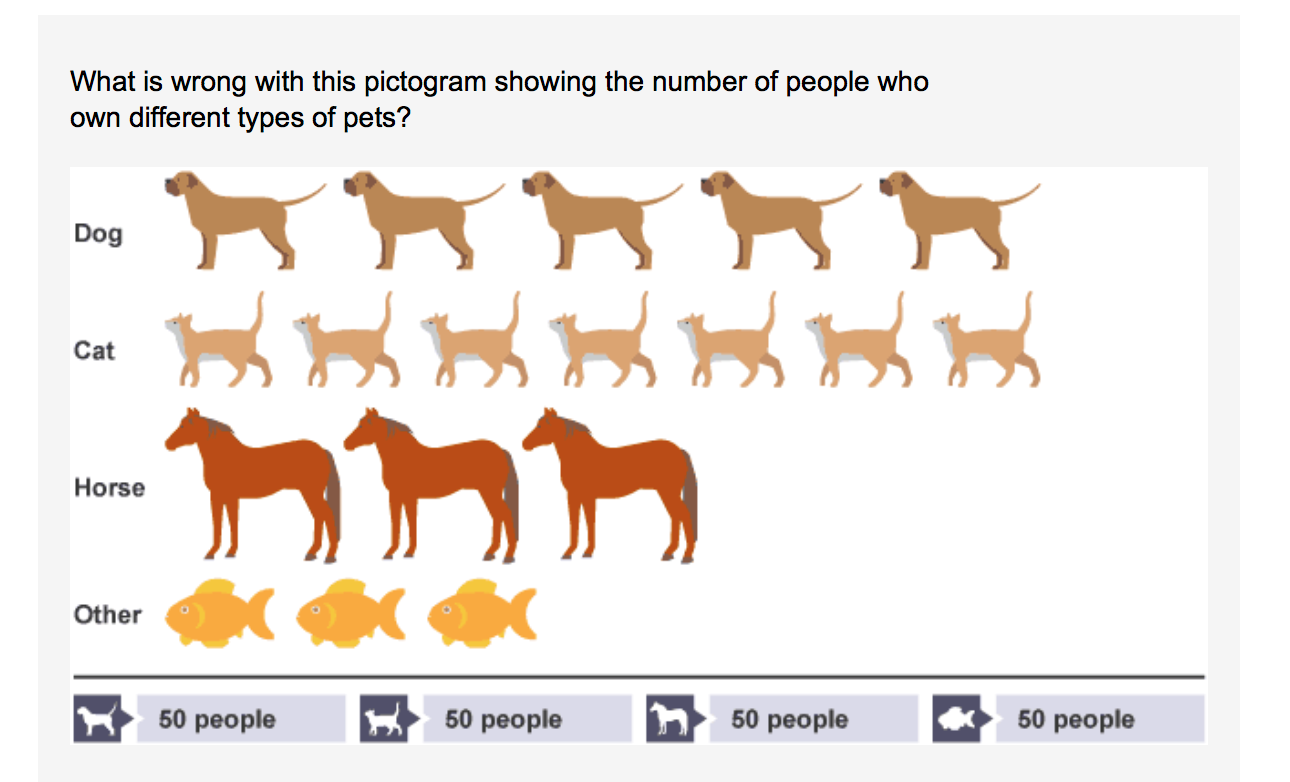
There is a misleading icon scale. Horses and fish have the same amount but horses are depicted as much larger. Most people own cats but it looks like just as many own dogs.

This graph is by far the most misleading. The raw numbers suggest that there are almost the same amount of working people as there are people on welfare. But when put in the graph, the bars represent 4 times the amount of people are on welfare rather than working a full time job.
In-Class Exercise – Day 14 – Finding Data Distortion
Finding Cool Visualization – Best Group Note
by Ksenia Semina and Albert Semin
https://www.bloomberg.com/graphics/2017-us- defense-against- north-korean- nuclear-attack/
a. What are the sources of the data visualized?
The sources of visualized data are the rockets, military bases and their action during a fired missile
from North Korea.
b. What are the key messages in these graphics?
The key message behind is that USA is ready to defend it self and has the technology to prevent an
attack in minutes.
c. What kind of delivery means do the graphics adopt to deliver the messages?
The graph uses 22-minute time lapse that shows the movement of the missiles and their direction.
It also shows that the US has military bases in Japan and South Korean that immediately report
back to the US.
https://www.bloomberg.com/graphics/2017-cities- chronic-flooding/
a. What are the sources of the data visualized?
The level of water on land during certain time of the year. How much flooding a city experiences
and how much has it increased over the several years.
b. What are the key messages in these graphics?
Shows the damage in the city by the water and how far can it spread with time because of climate
change.
c. What kind of delivery means do the graphics adopt to deliver the messages?
They show how the water expands further into the city over time laps to future years.
In-Class Exercise – Day 13 – Finding Cood Data Visualization
In-Class Exercise – Day 13 – Finding Cood Data Visualization.pdf
- Bloomberg (http://www.bloomberg.com/graphics)
- Pew Research Center (http://www.pewresearch.org/)
- The Economist (http://www.economist.com/blogs/graphicdetail)
- The New York Times (https://twitter.com/nytgraphics)
- The Wall Street Journals (https://www.pinterest.com/wsjgraphics/wsj-graphics/)
- The Washington Post (http://postgraphics.tumblr.com/)
- USA Today (http://www.usatoday.com/topic/E01C4890-85A2-4E0B-A3DD-58BD88E71251/interactive-graphics/)
In-Class Exercise – Day 6-8 – Introduction to Tableau
In-Class Exercise – Day 06-08 – Introduction to Tableau.pdf
Submission Link for September 15 class – https://templeu.instructure.com/courses/30770/assignments/32786
Best Hypotheses for Philadelphia Neighborhoods – Carly and Vincent
Carly Krzywicki and Vincent Mulvehill will get extra credit (0.5 out of 1 point) for the in-class exercise yesterday.
Hypothesis: “A Philadelphia neighborhood with more healthy corner stores experience lower crime rates.”
- Data source: Healthy Corner Store dataset (https://www.opendataphilly.org/dataset/healthy-corner-store-locations)
- Rationale: A neighborhood with more health-based corner stores is safer because more people are eating foods filled with nutrients that better the wellness of people. Eating more fruits and vegetables is often referred to as “brain food”, therefore this would help with their psychological mindsets.
Hypothesis: “A Philadelphia neighborhood that participates in vacant lot cleanups is more likely to experience less crime.”
- Data source: Vacant Lot Cleanups (https://www.opendataphilly.org/dataset/vacant-lot-cleanups)
- Rationale: A neighborhood that participates in vacant lot cleanups care about where they live, therefore they are less likely to commit a crime. People who respect the environment they live in and take care of it are less likely to do harm.
Hypothesis: “A Philadelphia neighborhood that experiences less rainfall causes less crime.”
- Data source: NOWData – NOAA Online Weather Data (https://www.opendataphilly.org/dataset/nowdata-noaa-online-weather-data)
- Rationale: A neighborhood that experiences less rainfall would have more sunshine, which allows for more endorphins to shine through and enter the atmosphere. Sunshine is known to make people happy due to these endorphins and the color yellow.