Data Analytics Projects
Data Analytics Challenge
In my MIS Intro class, I had to participate in the Temple Analytics Challenge as part of my course grade. The topic question that my group chose to answer was “Who is the best audience for cultural institutions?” We were provided with an excel spreadsheet that dealt with data of ticket sales to the Pennsylvania Ballet; we answered the question based on that heap of data by creating the infographic linked in the title above. The infograph is made up of multiple visual representations of the data we sorted such as mode of sales, ticket sales proportions in the US, and average ticket selling price. We concluded that the cultural institution the Pennsylvania Ballet should focus on online ticket sales that target the tri-state area of Pennsylvania, New Jersey, and Delaware.
ERD Diagram
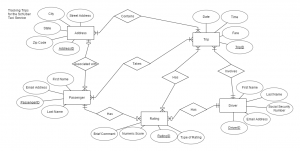
One of the most fundamental elements that one is taught about in MIS is how to create an ERD diagram by pulling information from a narrative to form an efficient system within an environment. In my Data Analytics class, an assignment we were given was to create an ERD based on tracking trips for a transportation service. The entities in this narrative were address, trip, passenger, rating and driver as shown in the boxes in the diagram. Reading into the narrative further, I was able to determine the relevant attributes for each of those entities, as shown in the ovals, and how they are related, as shown in the diamonds.
R Decision Trees
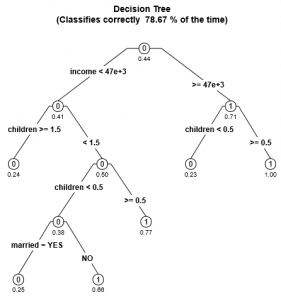
When learning how to use R and R Studio in my Data Analytics course this semester, the class was given an assignment to use the program to create a decision tree. We had to determine the likelihood of a customer paying back a bank loan. This was to be based off of the data provided such as age, sex, income, marriage status, and mortgage. Within the R script, we had to assign the tree with a complexity factor which ultimately determines how complex the decision tree will be. As complexity factor increases, the number of nodes decreases and the tree becomes simpler. As a result of getting simpler, the tree’s accuracy rate decreases and may even decrease the number of variables that it deems important to the decision-making process. In this case, the tree only classifies correctly 78.67% of the time based on the factors of number of children, marriage status, and income, which resulted in it having 6 leaf nodes.


