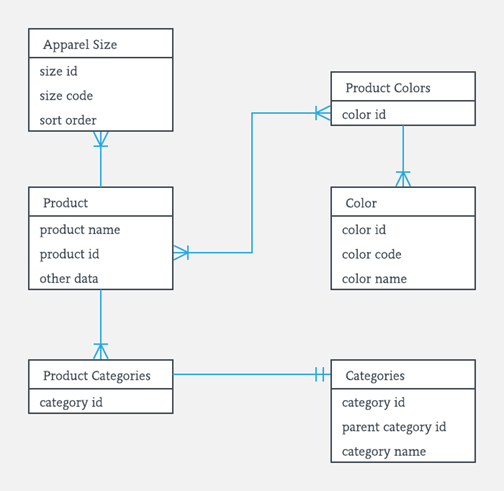
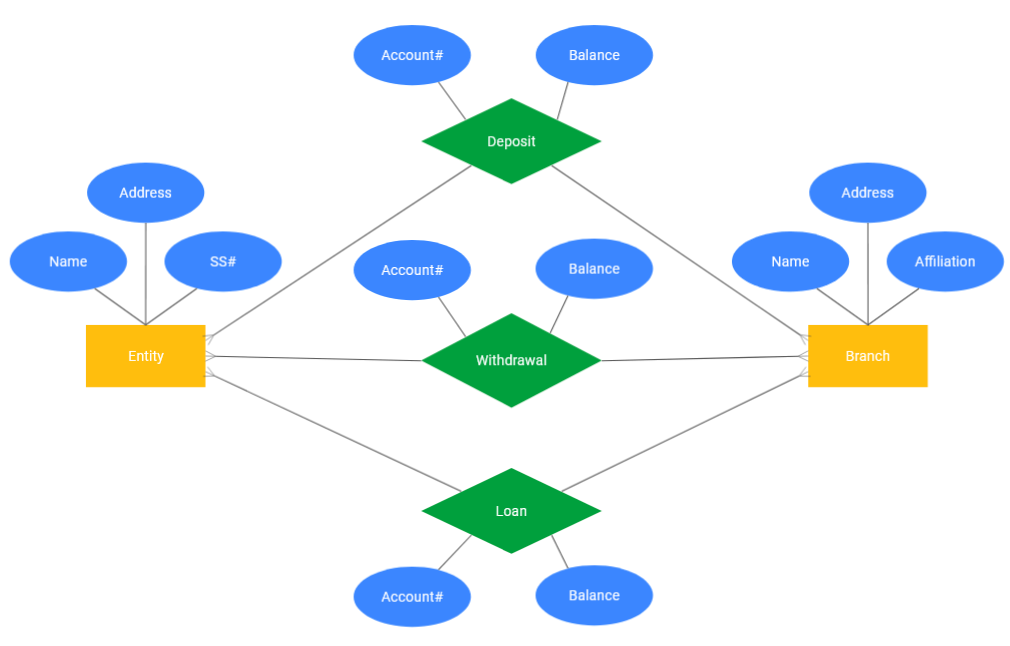
ERDs are a very useful tool for database creation. First, let’s dive into some background information about the diagrams. ERD stands for entity relationship diagram and is a data model visually representing the relationship between entities. There are two notations for ERDs, one being Chen’s database notation. This version consists of symbols representing the different components of an ERD. The entities are rectangles, the attributes are circles, and the relationships are diamonds. The other notation is Crow’s foot. This version has tables with the entity at the top, attributes listed below, and arrows connecting the tables to represent the relationships. So, why are ERDs so important? Why should we care about learning how to create and interpret them?
The entity relationship diagram provides a visual representation of a starting point for database design. It is an organized way to map out key information involving the database that is being created. So, when reviewing components of the database, it is easy to see what worked and what needs to be improved on. It is also easy to add said improvements. Then, since this information is saved into a diagram, creators can refer to it at any point in time, especially when working on other projects. I believe that learning how to create these organized visual diagrams is a useful tool, hence why it’s important to understand the ins and outs of the ERD.
Chen’s database image link: https://www.smartdraw.com/entity-relationship-diagram/
Crow’s foot database image link: https://www.guru99.com/er-diagram-tutorial-dbms.html
Thank you for the post. I think I can implement ERD structure to my workplace to organize some activities.
Kayla,
Amazing post! You clearly explained everything. I liked how you explained the importance each holds as well as explaining the different notations that can be used as well
Hi Kayla,
This is a thorough explanation of ERDs. I like the images you chose to visually represent the differences between the notations.