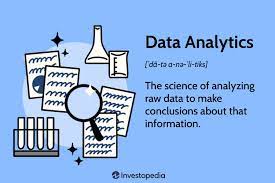
Data analytics is the use of tools and people to uncover data that is not readily available to the eye, such as patterns. There are three different types of data analytics, descriptive, prescriptive, and predictive. Descriptive data analytics is used when trying to answer the question “what happened?”. This is found using business intelligence (BI). Business intelligence is software that takes in data from a business and turns it over to the user in reports, dashboards, charts, and graphs. This software analyzes data and then presents it in a form that is easily understandable by the business in order to make a proper business decision. The descriptive analysis allows a business to understand its strengths and weaknesses. After the data has been analyzed and placed into visualizations for the users based on historical data, they perform predictive analytics. Predictive analytics uses this past data for the creation of future models. These models will predict the future outcomes of the business the data that has been previously collected. Using both predictive and descriptive analytics, prescriptive analytics allows for this data to be used to create optimization within the business. Optimization is the process of manipulating a business strategy or process in order to make it more efficient and less costly. Using optimization prescriptive analytics advises you on how to do your job the best you can.
The whole process starts with data, which is raw and unorganized facts. There are many sources from which data comes including systems, people, locations, platforms, and transactions. Each business retrieves the data, then gathers it, then stores it, and finally interprets it using data analytics. Google Analytics is a great example of data analytics and its use of it. Google Analytics captures user engagement, the number of sessions, the average time of a session, and the number of pages visited. They then interpret this data using data analytics to come to conclusions.
Hi Molly! I think your post about data analytics was awesome and I loved how you were able to describe data analytics and the three different types as well. Before reading into data analytics I found it interesting to know that it’s not as broad as you may think and that there are indeed three different types of it. The world is full of data and not many people really realize what data actually is until they really learn about it, like me in this class. I am definitely surprised by what I’ve learned and really what data is in the world. You wouldn’t really think off the top of your head that data included people like yourself. Google Analytics is a great tool, and I think apps like TikTok and Instagram allow you to see your user engagement and the demographics of your audience, which is super cool! It’s neat to know the information you may find in analytics.