Hello everyone,
Sometimes being able to see what’s going on within the company or organization can help you understand how things are related and if they are working properly. An Entity Relationship Diagram (ERD) is a visual diagram used for database design. ERD’s consist of three main parts; depicted by three symbols, the first symbol is a rectangle which represents entities, these are the nouns, it represents the person, the places, or the things. Next we have an oval which represents the attribute, these are the adjectives which describe the noun. Next we have a diamond shape which represents the relationship between two or more entities. Finally we have Crows foot notations, these are the lines that connect one or more entities. These lines can show a relationship that is represented by lines within the line. A single line depending on the end can represent one to one or one to many, this is shown by the shape of the line end. Below is a picture to show an example of what these lines look like.
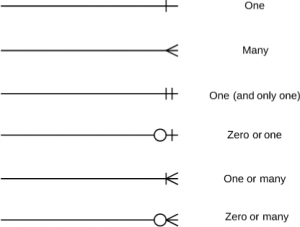
ERD’s allow you to see the connections between two or more entities, as well as a more in depth look at what each entity represents. This can be useful for any originations when trying to connect stored data and information.
I really like how you explained the two notations for the ERDs.
Overall I think that you explained ERD very well and explained the use and benefits of it!
Hey Lyzannette,
Your explanation about ERDs are helpful and the crows foot notations are simple to read. Crows feet explain the relationships.