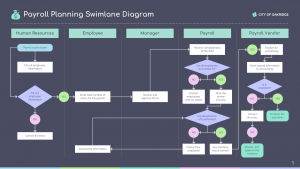
Swim lane diagrams are a way to visually represent all the steps of an information system in chronological order, who does what and at which stage. It’s a type of flow chart categorized by lanes (hence the name), and each lane represents a different actor in the system. These actors can be individuals, groups, divisions, or any similar entity, so long as the actor named is responsible for the steps in the assigned lane.
Steps in the diagram take a shape: Circle → start & end ; Rectangle → an activity in process ; Diamond → a decision that needs to be made ; Arrow → direction of the flow of the process ; Cylinder → stored data
Swimlanes are particularly useful to companies for identifying possible redundancies in the process, inefficiencies, or general problem areas. Visual representation in a logical manner makes it easier for our brains to process the information.
Leave a Reply
You must be logged in to post a comment.