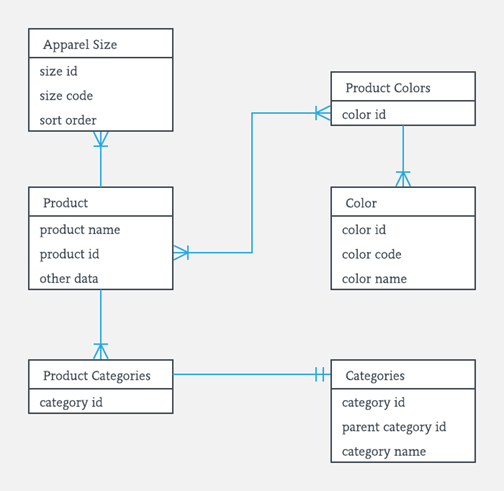
ERD, also known as Entity Relationship Diagram, is a visual representation of different data to describe how they are related. The two notions for ERD are Chen’s and Crow’s. Chen uses rectangles and diamonds to show a relationship, and Crow uses rectangles to connect to another rectangle to show a relationship. There are three primary symbols for ERD: entity, attribute, and relationship. The entity uses nouns, Attribute uses adjectives or characteristics, and relationships use verbs. The three crow’s foot notation is 1:1, which is a “one-to-one relationship,” 1:m is “one to many,” is to many relationships, and last is m:m, a “many-to-many relationship” this help describe the characteristic of the relationship between two entities. I think the key thing of an ERD table is to label if you don’t label your boxes and lines, you might end up lost. Or make sure you’re using the right Chen’s or crowfoot notion for your ERD table.
 Threat modeling is when the user thinks about who would potentially try to breach data to better protect it. It reminds me of how detectives will try to solve a case by putting themselves in the suspects’ shoes—they try to think like the suspect in order to predict what moves the suspect would make. As technology becomes more and more of an essential part of daily life, data breaches and cyberattacks are quickly jumping the list of the most likely global risk, trumped only by natural disasters and extreme weather events.
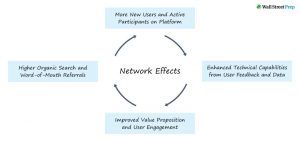 The network effect happens when the value of a good or service rises as an indirect effect of more people using it. There isn’t always an obvious change, but it is not purely coincidental that platforms that start to gain more traction also start to earn more money. A good example of this is Facebook—Facebook started to grow and evolve as more people started creating accounts and using Facebook, thus also adding more data. Facebook began earning more money as it collected valuable information about customer preferences and running ads.