Weekly Question: 25th Sept
Look at the two charts that are shown below: What are they both trying to show? Which one did you find easier to read? Why?
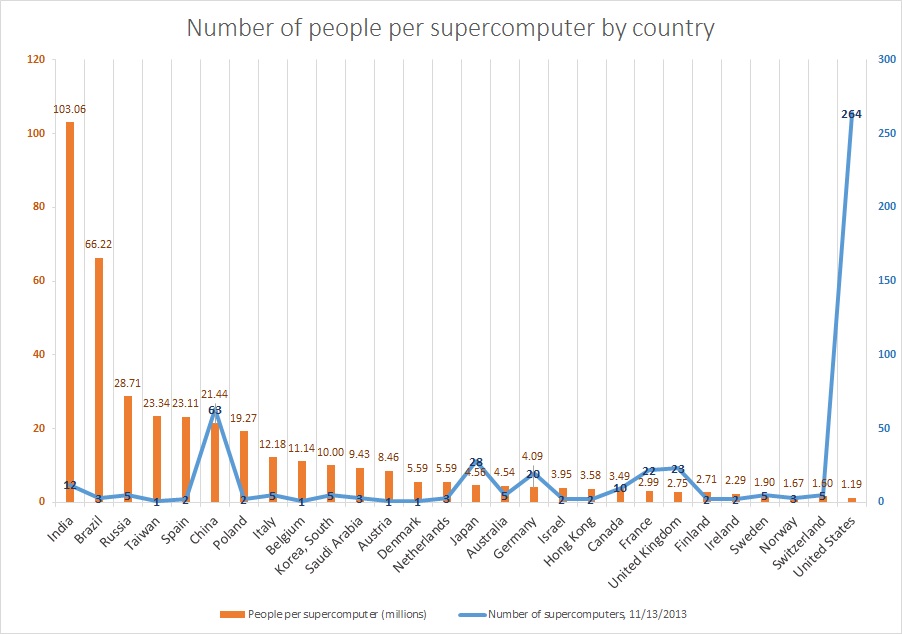
Chart 1
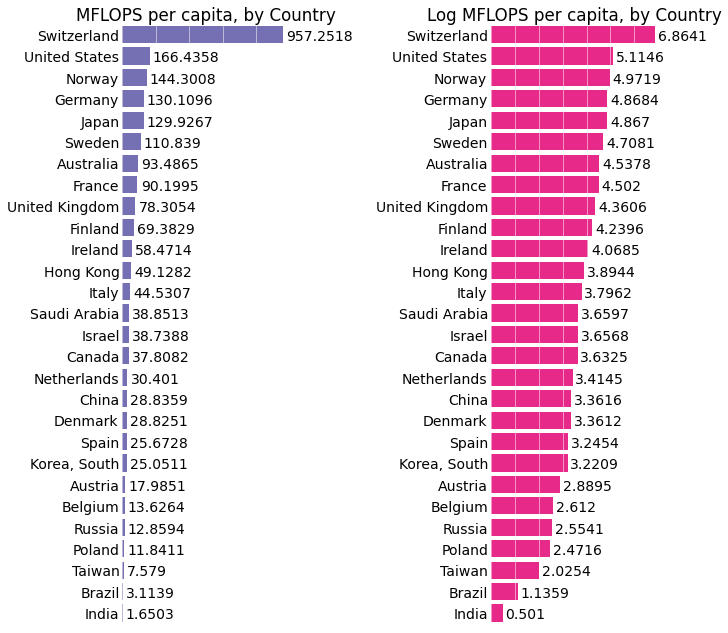
Chart 2
Look at the two charts that are shown below: What are they both trying to show? Which one did you find easier to read? Why?
Chart 1
Chart 2
57 Responses to Weekly Question: 25th Sept