

Tableau Project – MIS 0855 Data Science – Spring 2016
Tableau Project – MIS 0855 Data Science – Spring 2016
In Data Science, the final project is to analyze a data set of your choice. My group chose to analyze a data set released by the Guardian(“1000 Songs to Hear Before You Die”).
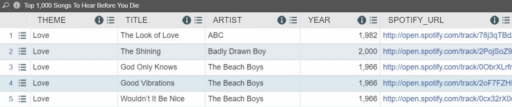
The data contained the theme of the song, the title, artist, year it was produced and possibly a link to the piece. These data fields directed what my team analyzed.
We started with the song themes. We wondered- which theme had the most songs on the list? Were they all equal?
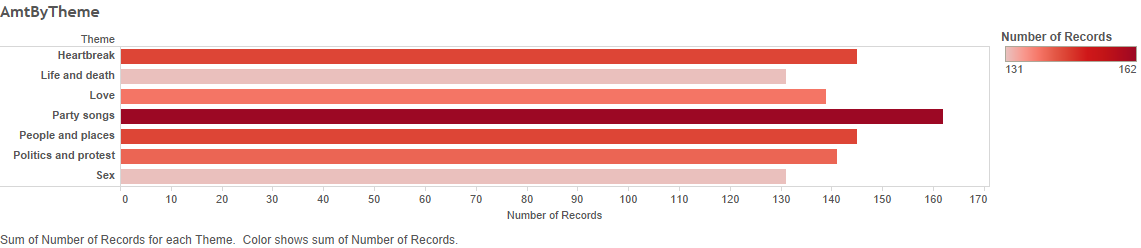
Every theme had at least a hundred songs represented. Party songs were the clear winner with 162 songs making the list. This did not surprise us in the least- it can often seem like every popular song is a party song.
Next, we looked at the years the songs were produced.
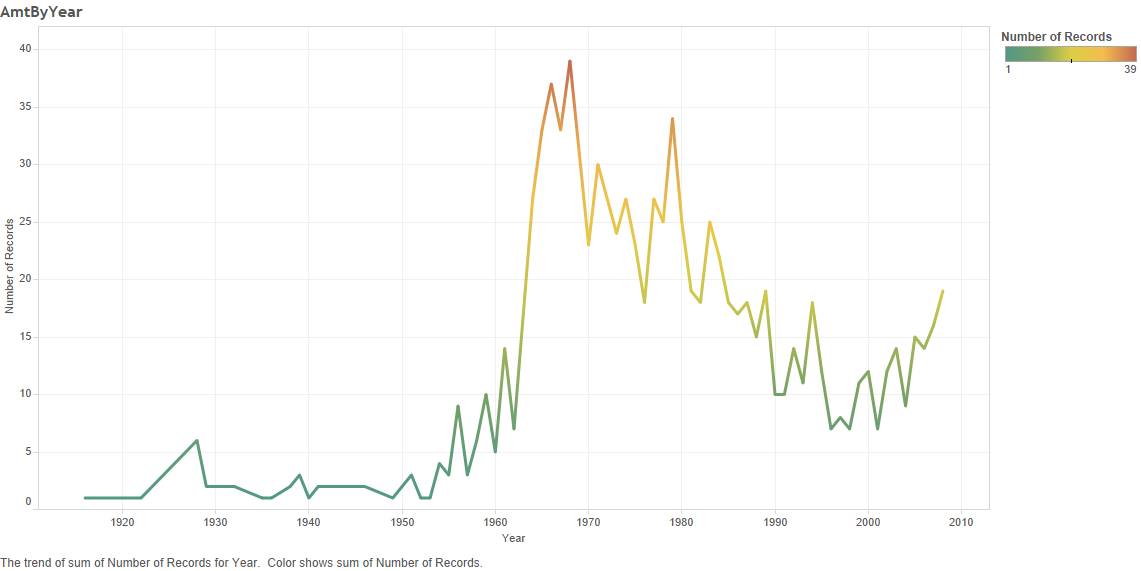
This graph was the most interesting to me. The article was published in 2009, so the records end in 2008, but they begin all the way back in 1916! This graph not only shows how lasting music can be, but also makes it obvious that 1960-1980 was a musical moment in the United States.
Finally, we wondered what artists were represented in this data.
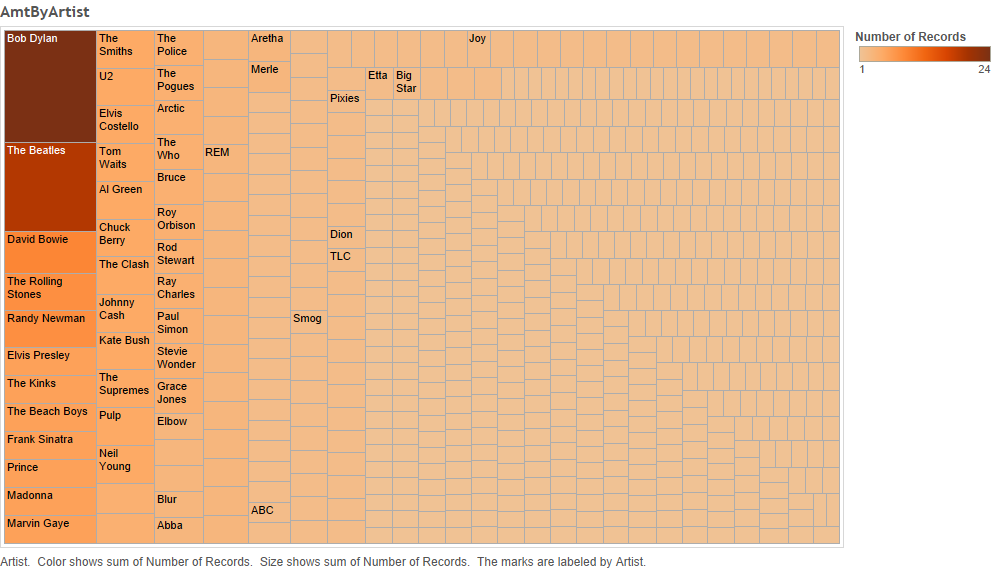
The high majority of artists had less than five songs on the list. However, the Beatles and Bob Dylan are worth a respective 19 and 24 songs. This data illustrates that musical icons can span the decades, and that music listeners may consider older music to be inherently better. If nothing else, it shows what music the editor of the article enjoys.