Sample Work
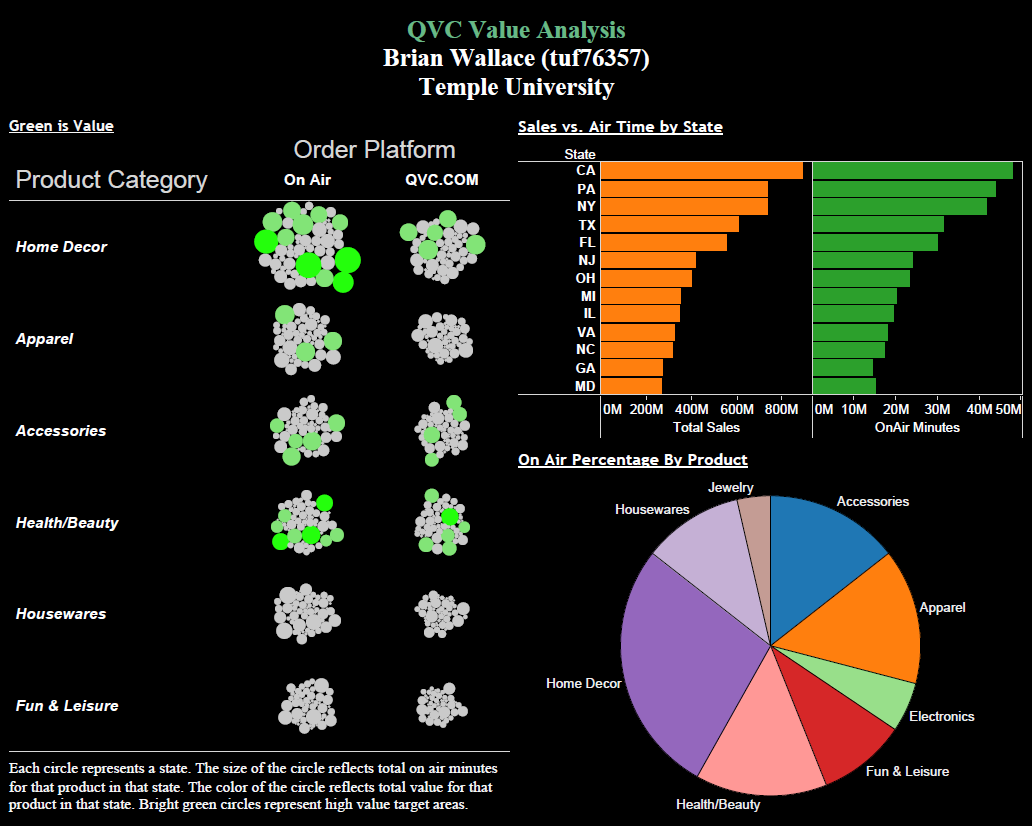
QVC DATA ANALYTICS
This graphic is useful in identifying target value areas for both OnAir orders and OnLine orders. The bar graph in the top right compares total air time for all QVC products in each state against total sales in each state. The graph clearly shows a positive correlation between air time and total sales. The pie chart in the bottom right reflects the percentage of national air time devoted to the top selling product categories. This definitively shows that over a quarter of national air time is devoted to Home Décor, which is conversely the highest selling product from both OnAir and OnLine orders. Lastly, the “Green is Value” graphic on the left reflects the highest value areas that QVC should target with either more on air time, or more on line campaigning. For example, Home Décor has high OnAir order value for several states, but does not match that value with OnLine orders. Health and Beauty on the other hand has high value compared to its rather low airtime, and even reflects a strong presence in California’s OnLine ordering. I would use this graphic to target specific states with more airtime, or more on line campaigns. The goal of QVC should be to generate the maximum number of bright green circles, regardless of size.
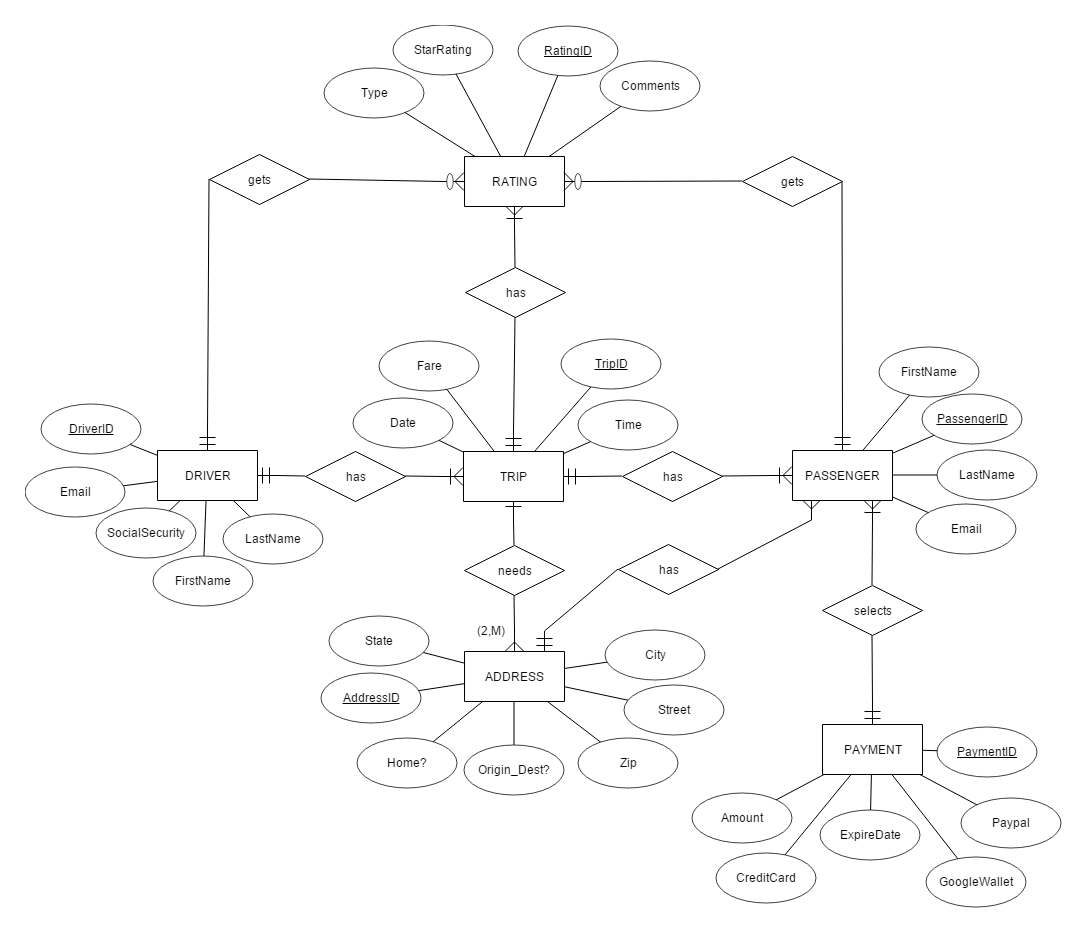
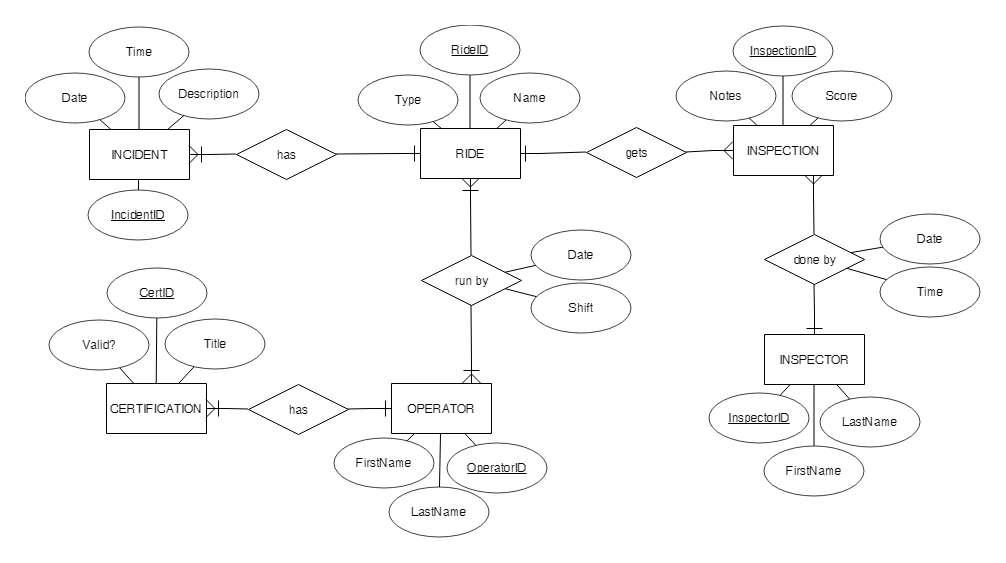
ENTITY RELATIONSHIP DIAGRAM
This was a project from MIS 2502 (Data Analytics). I was prompted to map out an Entity-Relationship diagram that maps out the workings of an Uber-like business. The prompt needed to be analyzed and made into its own chart. This helped me gain valuable skills in information architecture that can one day be used in a business.
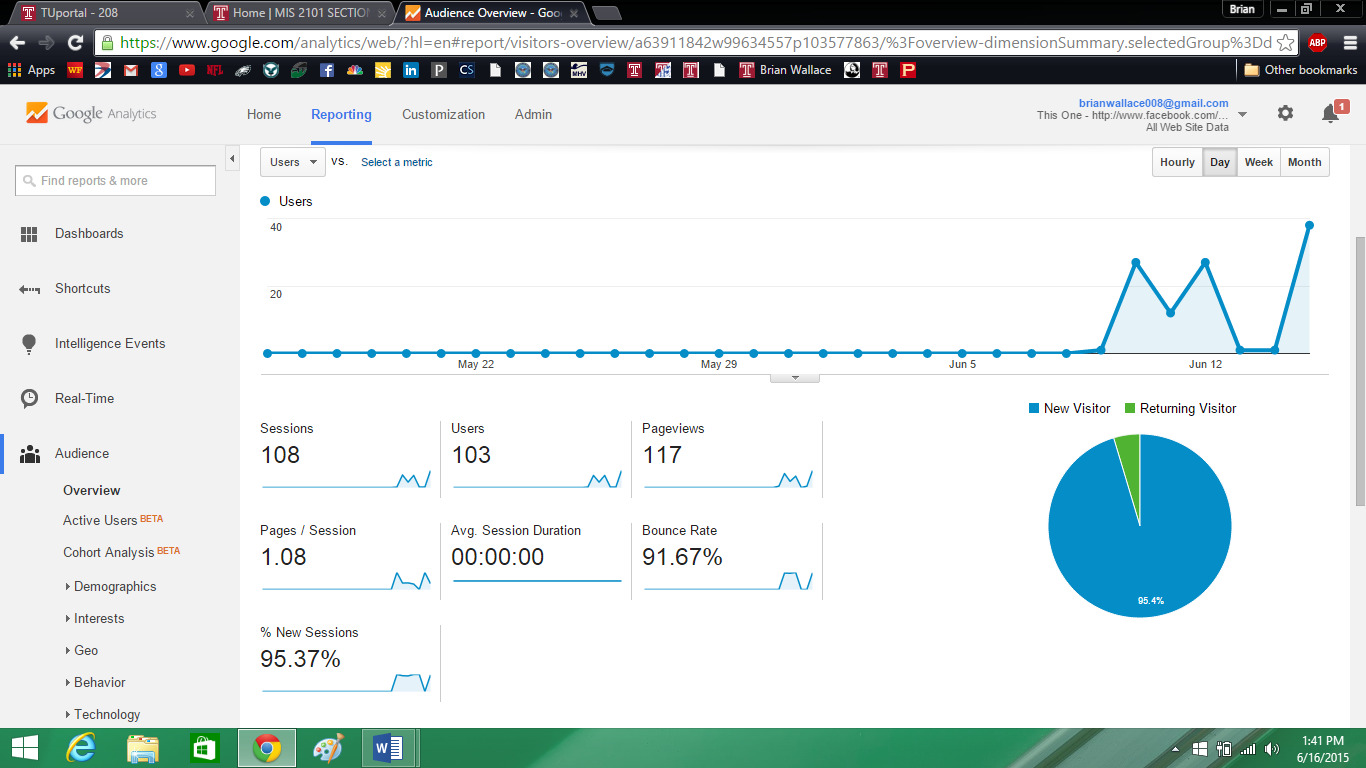
GOOGLE ANALYTICS
Assessing the web traffic on my ePortfolio was part of my MIS2502 course work. After creating a basic website, I was tasked with monitoring, analyzing, and reporting on the web traffic and user behavior.