Temple Analytics Challange
MIS 2502 Data Analytics: Entry for Data Visualization Challange
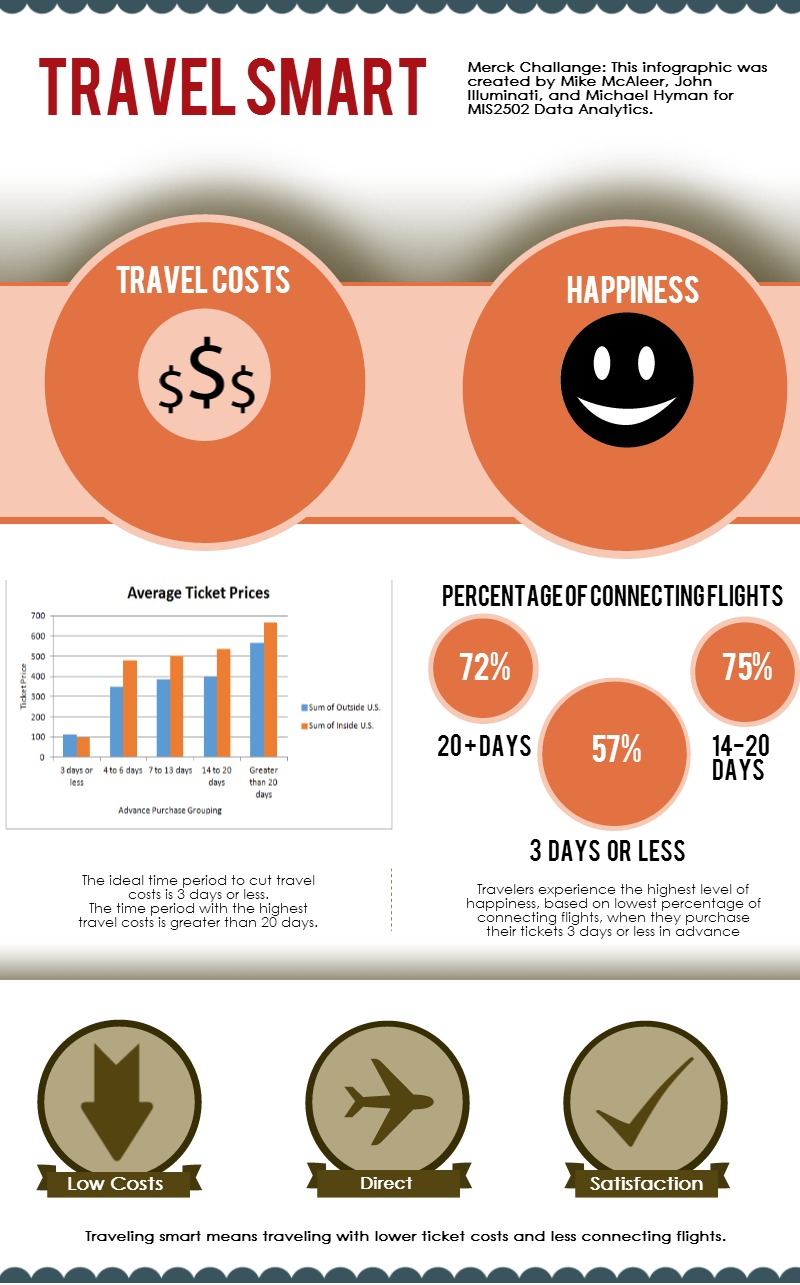
The challenge’s focus is making sense of big data through visualization. Visualization is a key component of data analytics, and experts cite visualization as a path to a “hot job” in big data.
My team and I created an original graphic that provided clear and meaningful insight into the presented problem.