For the studio portion of this class, you and 3-5 classmate(s) will be working on a project and learn how to assume the role of a product manager. As a team, you will create & assemble artifacts and deliver digital product(s) to our client(s).
Your contributions to the team project will be reviewed by your teammate(s). Their feedback on your contributions to the team project will be affecting your individual final team project grade (5% of your total grade).
- Teams listing: MIS3535 Team List v3
Project Description
Fabriq Analytics Project Description_v1
2 logos provided:
![]()
![]()
Input from client received on 9/21:
- Websites that client likes:
- Tableau Embedded Analytics instructions
- In the process of getting quotes from clients
- Images/Photos coming soon!
Input from client received on 9/25:
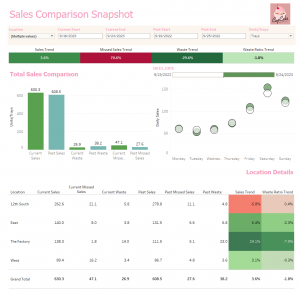
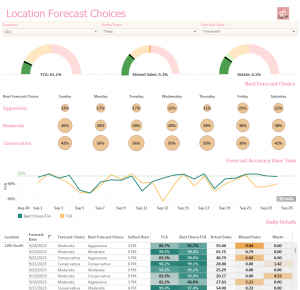
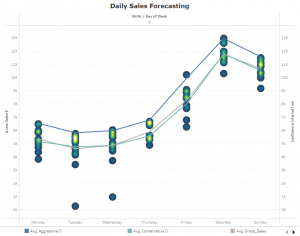
Below you will find pictures of dashboards and a video of an app. Also here’s a good website for free videos and pictures for website builders. https://www.pexels.com/
Input provided by the client on 10/4:
email: Jesse@fabriqanalytics.co
Integrity – We are transparent, honest, and accountable for our actions. We’re fostering an environment of trust that empowers relationships and successful business ventures.
Customer Success – Customers are the reason we work and innovate. We put the customer at the center of our decisions and long-term vision as a company. When customers win, we win.
Innovation – The status quo is not something we’re satisfied with. We tirelessly learn and adjust to bring our customers the best solution possible.
- Initial Consultation: We meet to discuss your needs and objectives. Decide what products and services are needed. (Cloud database, custom app, Tableau dashboards, sales forecasting models etc.)
- Requirement Analysis: Thorough analysis of your requirements, including data sources, types of analytics needed, and any special features or functionalities required.
- Proposal and Agreement: Based on the analysis, we present a proposal outlining the scope of work, project timeline, costs, and deliverables.
- Design and Development: We design, develop, tweak and collaborate on your project.
- Testing: We test your product and get a final signoff on data validity and performance.
- Deployment: Your product is rolled out and ready to be used. We provide training and documentation as well as support and maintenance.
- Long-Term Partnership: We hope to become a long-term partner in the success of your business. When you win, we win.

Input provided by the client on 11/8:
Client testimonies:
- “Fabriq Analytics has been a game-changer for Five Daughters Bakery! We have been able to level up our data management and understanding in several different ways including data storage in the cloud for quicker and wider access, converting multiple manual workflows to automation and substantially improved reporting and forecasting. All of this and more has led to us improved our efficiency in several dimensions, a better understanding of our workflow as an entire organization and $$$ added to our bottom line. If you’re serious about data-driven decisions, I highly recommend Fabriq Analytics! – John W”
- “Fabriq is amazing! They took all the app dreams in our brain and made them a reality. They were so fun to work with and full of yeses to everything we hoped we could accomplish! I would definitely work with them again! – Kayla H.”
Input provided by the client on 11/10:
Questions for Contact us:
• Name
• Email
• Phone
• Business website
• Industry
• Interested in:
– Cloud Dashboards
– Data Automation
– Custom Business App
– All of the above
• Would you like to tell us anything else?
Public Dashboard: Pubic Dashboard
Cloud Dashboard – Use Case:
You want a comprehensive view of your business’s performance that aligns with your unique needs. The standard reports generated by your online sales platform or CRM just don’t cut it, and the thought of manually creating reports every month is overwhelming.
Here’s how we can help: Harnessing the capabilities of Tableau, we craft tailored reports that reflect your requirements, granting you access from anywhere at any time. The data is continuously refreshed, ensuring you’re always working with the latest information.
Data Automation – Use Case:
You want seamless communication between your data sources and want to eliminate redundant data tasks. But your sales data, employee scheduling and product details are in separate platforms, so this seems impossible.
Here’s how we can make a difference: We leverage the capabilities of a cloud database to gather your data from all your sources, consolidating them into a single, unified repository. We then automate your manual data tasks saving you countless hours. Finally, we build specific views of data that show your information in the format you need.
Custom Business App – Use Case:
You want the power to receive task notifications and access business data at your fingertips. Existing task tracking platforms necessitate manual data input, forcing you to copy and paste information, and they often fall short in terms of capabilities.
Here’s where we come in: By harnessing your data, we design a custom web application that not only showcases your information but also automatically generates the tasks and notifications you desire.