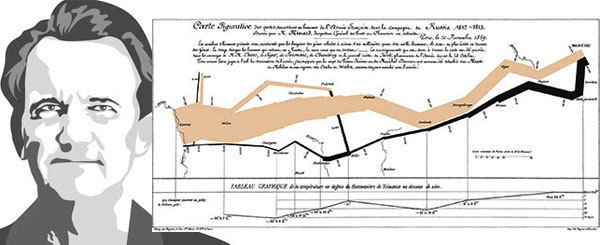
Who is Edward Tufte?
Edward Tufte is an analytical design theorist, educator, and landscape sculptor best known for his self-published books on analytical design. Furthermore, Edward Tufte was famously known for noting his writings and impact on information design such as scatter graphs, bar charts and line graphs including so many more graphical graphs , and also Edward Tufte was a pioneer of data visualisation meaning how data (a.k.a information) is presented as graphical content for important use.
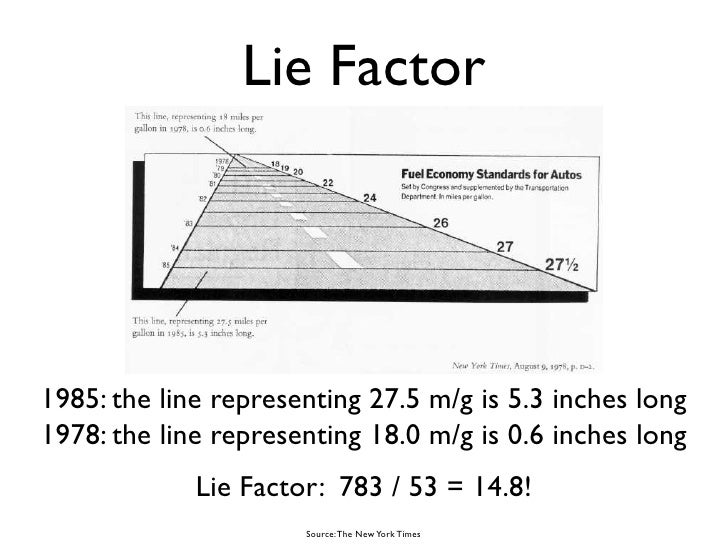
Measuring Misrepresentation
The lie factor is calculated by dividing the size of the effect shown in the graphic by the size of the effect in the data.
If the lie factor is GREATER THAN 1 the graph OVERSTATES the effect.
Principles of Graphical Integrity
- The representation of numbers, as physically measured on the surface of the graph itself, should be directly proportional to the numerical quantities represented.
- Clear, detailed and thorough labeling should be used to defeat graphical distortion and ambiguity. Write out explanations of the data on the graph itself. Label important events in the data.
- Show data variation, not design variation
- In time-series displays of money, deflated and standardized units of monetary measurement are nearly always better than nominal units.
- The number of information carrying (variable) dimensions depicted should not exceed the number of dimensions in the data. Graphics must not quote data out of context.
- Graphics must not quote data out of context
Source:
http://classes.engr.oregonstate.edu/eecs/spring2015/cs419-001/Slides/tufteDesign.pdf