Uncategorized
Your reading list for KPIs
Your reading list for dirty data, 7.1, 7.2
Study Guide for Exam 1
Here is the study guide for the first midterm exam. Here is also a more detailed version based on notes from class.
Readings for week 5 (infographics 101)
Readings for Week 4
Session 4.1:
- Chapter 2: Good Graphics? Handbook of Data Visualization (Unwin—-pages 57-77)
Session 4.2:
Try some spurious correlations!
Here is the website I showed you in class today. Take a look and make your own correlations!
Good read/study on bias in big data/algorithms
Here’s a good read on Pew on AI and bias. It’s going to be an ongoing topic in your careers well beyond this class.
Data, analytics outlook for marketing, advertising; Is Facebook evil?
A few bonus reads for those of you interested…
Some of you noted you have a focus communication, PR, advertising and marketing. Here’s an IAB report/outlook on emerging data trends in advertising (as it applies to digital media).
Related riff on whether Facebook and Internet companies are evil. A whole lot of data (and metadata) in those Facebook databases.
And the most recent item on Facebook’s impact on mental health
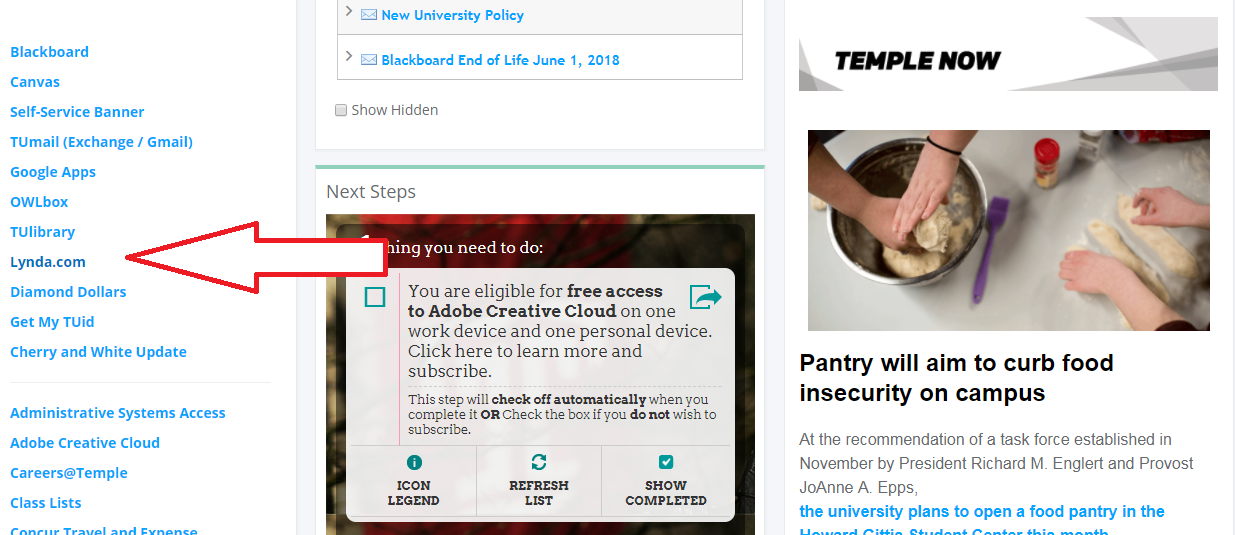
In class exercise 3.2: Tableau fundamentals with Lynda
On your Temple portal, you have access to a service called Lynda. It’s a video training company that LinkedIn bought a few years back and is now part of Microsoft, which acquired LinkedIn.
In either case, we are going to skip around a bit in the training to get you acquainted with it. It’ll will come in handy next week. Once you’re in Lynda, you create a quick profile and search for Tableau. There’s a basics course there.