Weekly Question #5: R
Leave your response as a comment on this post by June 16, 2017. Remember, it only needs to be three or four sentences. For these weekly questions, I’m mainly interested in your opinions, not so much particular “facts” from the class!
If you sign in using your AccessNet ID and password you won’t have to fill in the name, email and captcha fields when you leave your comment.
Here is the question:
Do a little bit of research and come up with an example of how R is used. You can describe either a company using R and what they use it for, a news story about how companies are using it, or an interesting package that does some interesting functionality. Write one to three sentences on what you found and the URL where you found it.
(Hint: Just Google “companies using R” or “applications of R” or something like that. Examples aren’t too difficult to find)
In-Class Assignment #9: Descriptive Statistics Review
Here is the assignment.
Here is the solution.
Assignment #6: Getting Familiar with R and R Studio
Here are the assignment instructions. Fill out this word document and submit your answers.
Here is the data set for the assignment. (OnTimeAirport)
This assignment will be due on Thursday, June 15th by 11:59 PM.
Assignment #5: Analyzing Data Cubes and Pivot Tables
Here is the assignment.
Here is the workbook (VandelaySales).
This assignment is due Sunday, June 11th by 11:59 PM.
In-Class Exercise #8: Pivot Tables
Weekly Question #4: Data Visualization
Leave your response as a comment on this post by June 9, 2017. Remember, it only needs to be three or four sentences. For these weekly questions, I’m mainly interested in your opinions, not so much particular “facts” from the class!
If you sign in using your AccessNet ID and password you won’t have to fill in the name, email and captcha fields when you leave your comment.
Here is the question:
Consider the best practices for data visualizations we discussed in class. Take a look at two infographic sites: The Daily Infographic and Cool Infographics. Find a graphic that does a nice job of telling a story. Post a link to the graphic and explain why you think it’s an example of a good data visualization.
Assignment #4: ETL
Here are the assignment instructions.
Here is the ETL Workbook.
This assignment is due by Thursday, June 8th at 11:59 PM.
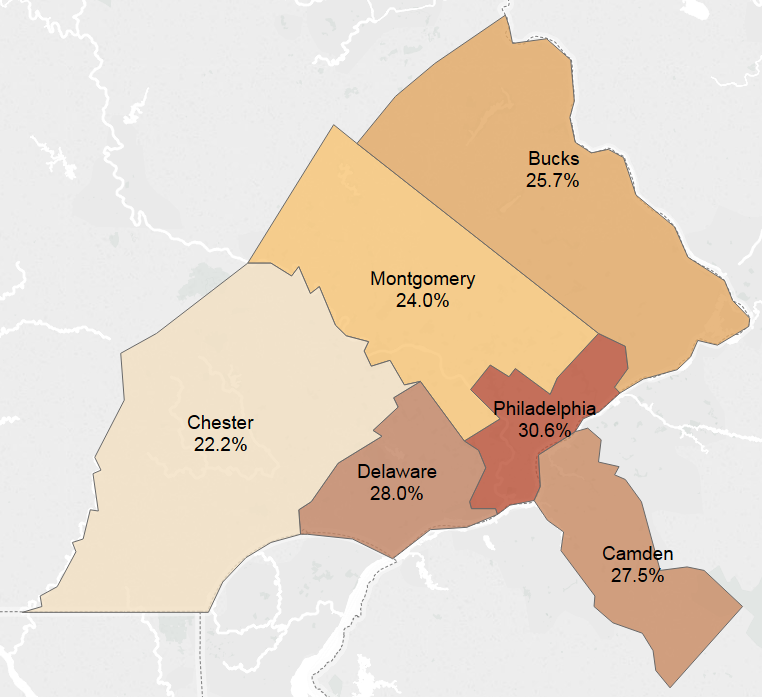
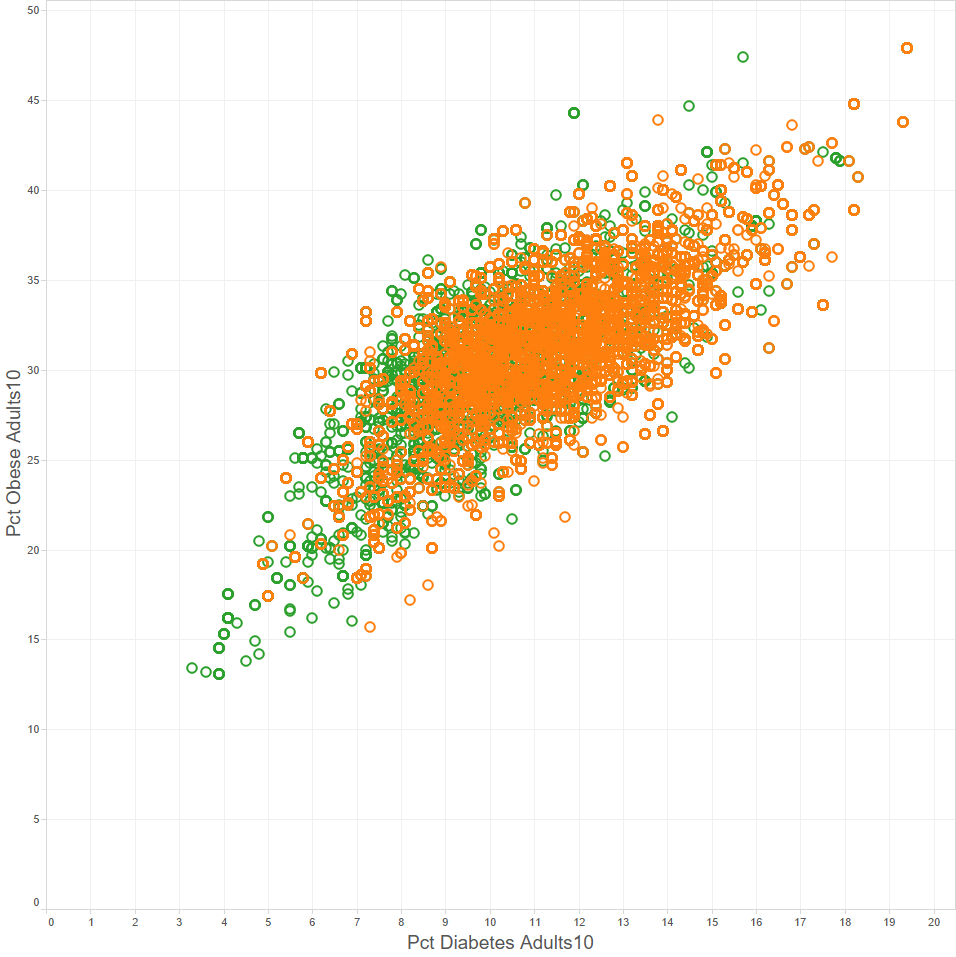
In-Class Exercise #7: Data Visualization
Here is the exercise.
Here is the data set, Philadelphia Area Obesity Rates & Impact of Beverage Prices.
Assignment #3: SQL Part 2
Here’s the assignment. We’ll discuss the rescheduled due date in class tomorrow.
Recent Comments