

Data Analytics Challenges
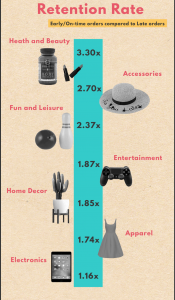
My team and I examined QVC’s customer geography, distribution network, and product mix, purchase patterns to understand the relationship between the speed of package delivery and customer loyalty. We utilized Azure, SPSS, MySQL, and Excel to conduct various statistical testing such as survival analysis and linear regression on more than 6 million rows of data. Then, I conceptualized, visualized, and designed an infographic and an animated slide deck using Tableau, Adobe Photoshop, and PowerPoint based on color theory, typography and design principles.
Our submission won first place for analytics at the Temple round. For the national round, I redesigned the infographic and we added some more in-depth suggestions. As a result, we won first place for graphics at the national AIS competition.
Temple Data Analytics Challenge – First Place, Analytics Track
(preview)
 |
|
|
|
|
|
National Data Analytics Challenge – First Place, Graphic Track
(preview)
 |
 |
 |
 |