
Flash Research Paper
In Enterprise IT Architecture, I wrote this Flash Research Paper (linked here) to demonstrate the capabilities of a Tier 4 Data Center.
Association for Information Systems Executive Board

Beginning in the Fall of 2017, I was selected to be the Director of Corporate Relations for Temple’s chapter of the Association for Information Systems. This student-run professional organization is the only student organization for MIS majors at the Fox School of Business. As an organization, we help to personally, professionally, and technically develop our members into the strongest professionals they can become.
In my role, I am in charge of planning and organizing AIS’ weekly Speaker Series. This is where we bring in a professional in the IT industry to speak to our members about their experiences and knowledge. Past Speaker Series guests have included professionals from Wal-Mart, QVC, and Campbell’s Soup.
This semester, we are off to a great start! Our students have meet with the professionals from companies like Grant Thornton, EY, Scholastic, and IBM. I also plan and host a weekly sit-down lunch with our guest speaker of the day and a small group of high-achieving members. These lunches are a great networking opportunity for our members and offer the unique experience of face-time with professionals in many different levels of their careers.
Working with the all of the other members of our AIS Executive Board has been an incredible experience so far, and I cannot wait to see what the rest of this year will bring!
Hosting the MIS Alumni Start-Up Panel as part of our Fall 2017 Speaker Series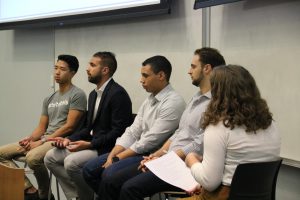
Fox MIS Graduate Programs Administrative Assistant

Starting in the Summer of 2017, I accepted a position within the MIS Department at Temple, assisting with prospective student management and enrollment for the MS in IT Auditing and Cyber Security and MS in Digital Innovation in Marketing programs. In this position, I normalize and manage the data on our student leads and applicants, incorporating data from multiple sources into one extensive Excel document. I also correspond with students by sending follow-up messages after they have attended an event, and answering questions they may send me about either program.
One of my main accomplishments so far in this position was creating a data summary page in each of our prospect documents. The summary shows how many students are at each stage of the application process, such as starting an application, being accepted, and deposited, and show, of those students, how many are full-time or part-time students, international or domestic, and what their concentration will be in the program. I used multiple Excel formulas to create this page which automatically updates when any changes are made in the main prospect worksheet. I have also incorporated PivotTables to show exactly which states and countries our students are coming from, and the lead source to show how they found out about the program. This helps the program directors be able to know at a glace where the programs stand on admissions, and see where they should invest into more advertising and promotion efforts.
This position, in such a short time, has greatly increased my proficiency in Excel and my communication skills. I look forward to being able to continue my work with the MIS department into the future.
Grow With Grant Thornton Summer Leadership Program
![]()
In June of 2017, I was selected to attend the Grow with Grant Thornton Summer Leadership Program. This office visit and three-day conference helped me become a better leader and team member, and broaden my knowledge about the firm and their services. At our visit in the Philadelphia office, myself and the other students were able to learn about the culture of GT, reverse interview with a senior associate or manager, and gain insights into our service line of choice.
To me, one of the best things about GT as a firm is their culture. It is clearly very important to all of their employees, as it is emphasized at many events. Their CLEARRly1 model gives a uniformed set of goals for their employees to strive for, and it has certainly worked. Each employee I interacted with at Grant Thornton exemplified their values and could not have been more welcoming or kind. At our Philadelphia office visit, we participated in activities that showcased this culture, and this experience only made me love the firm more.
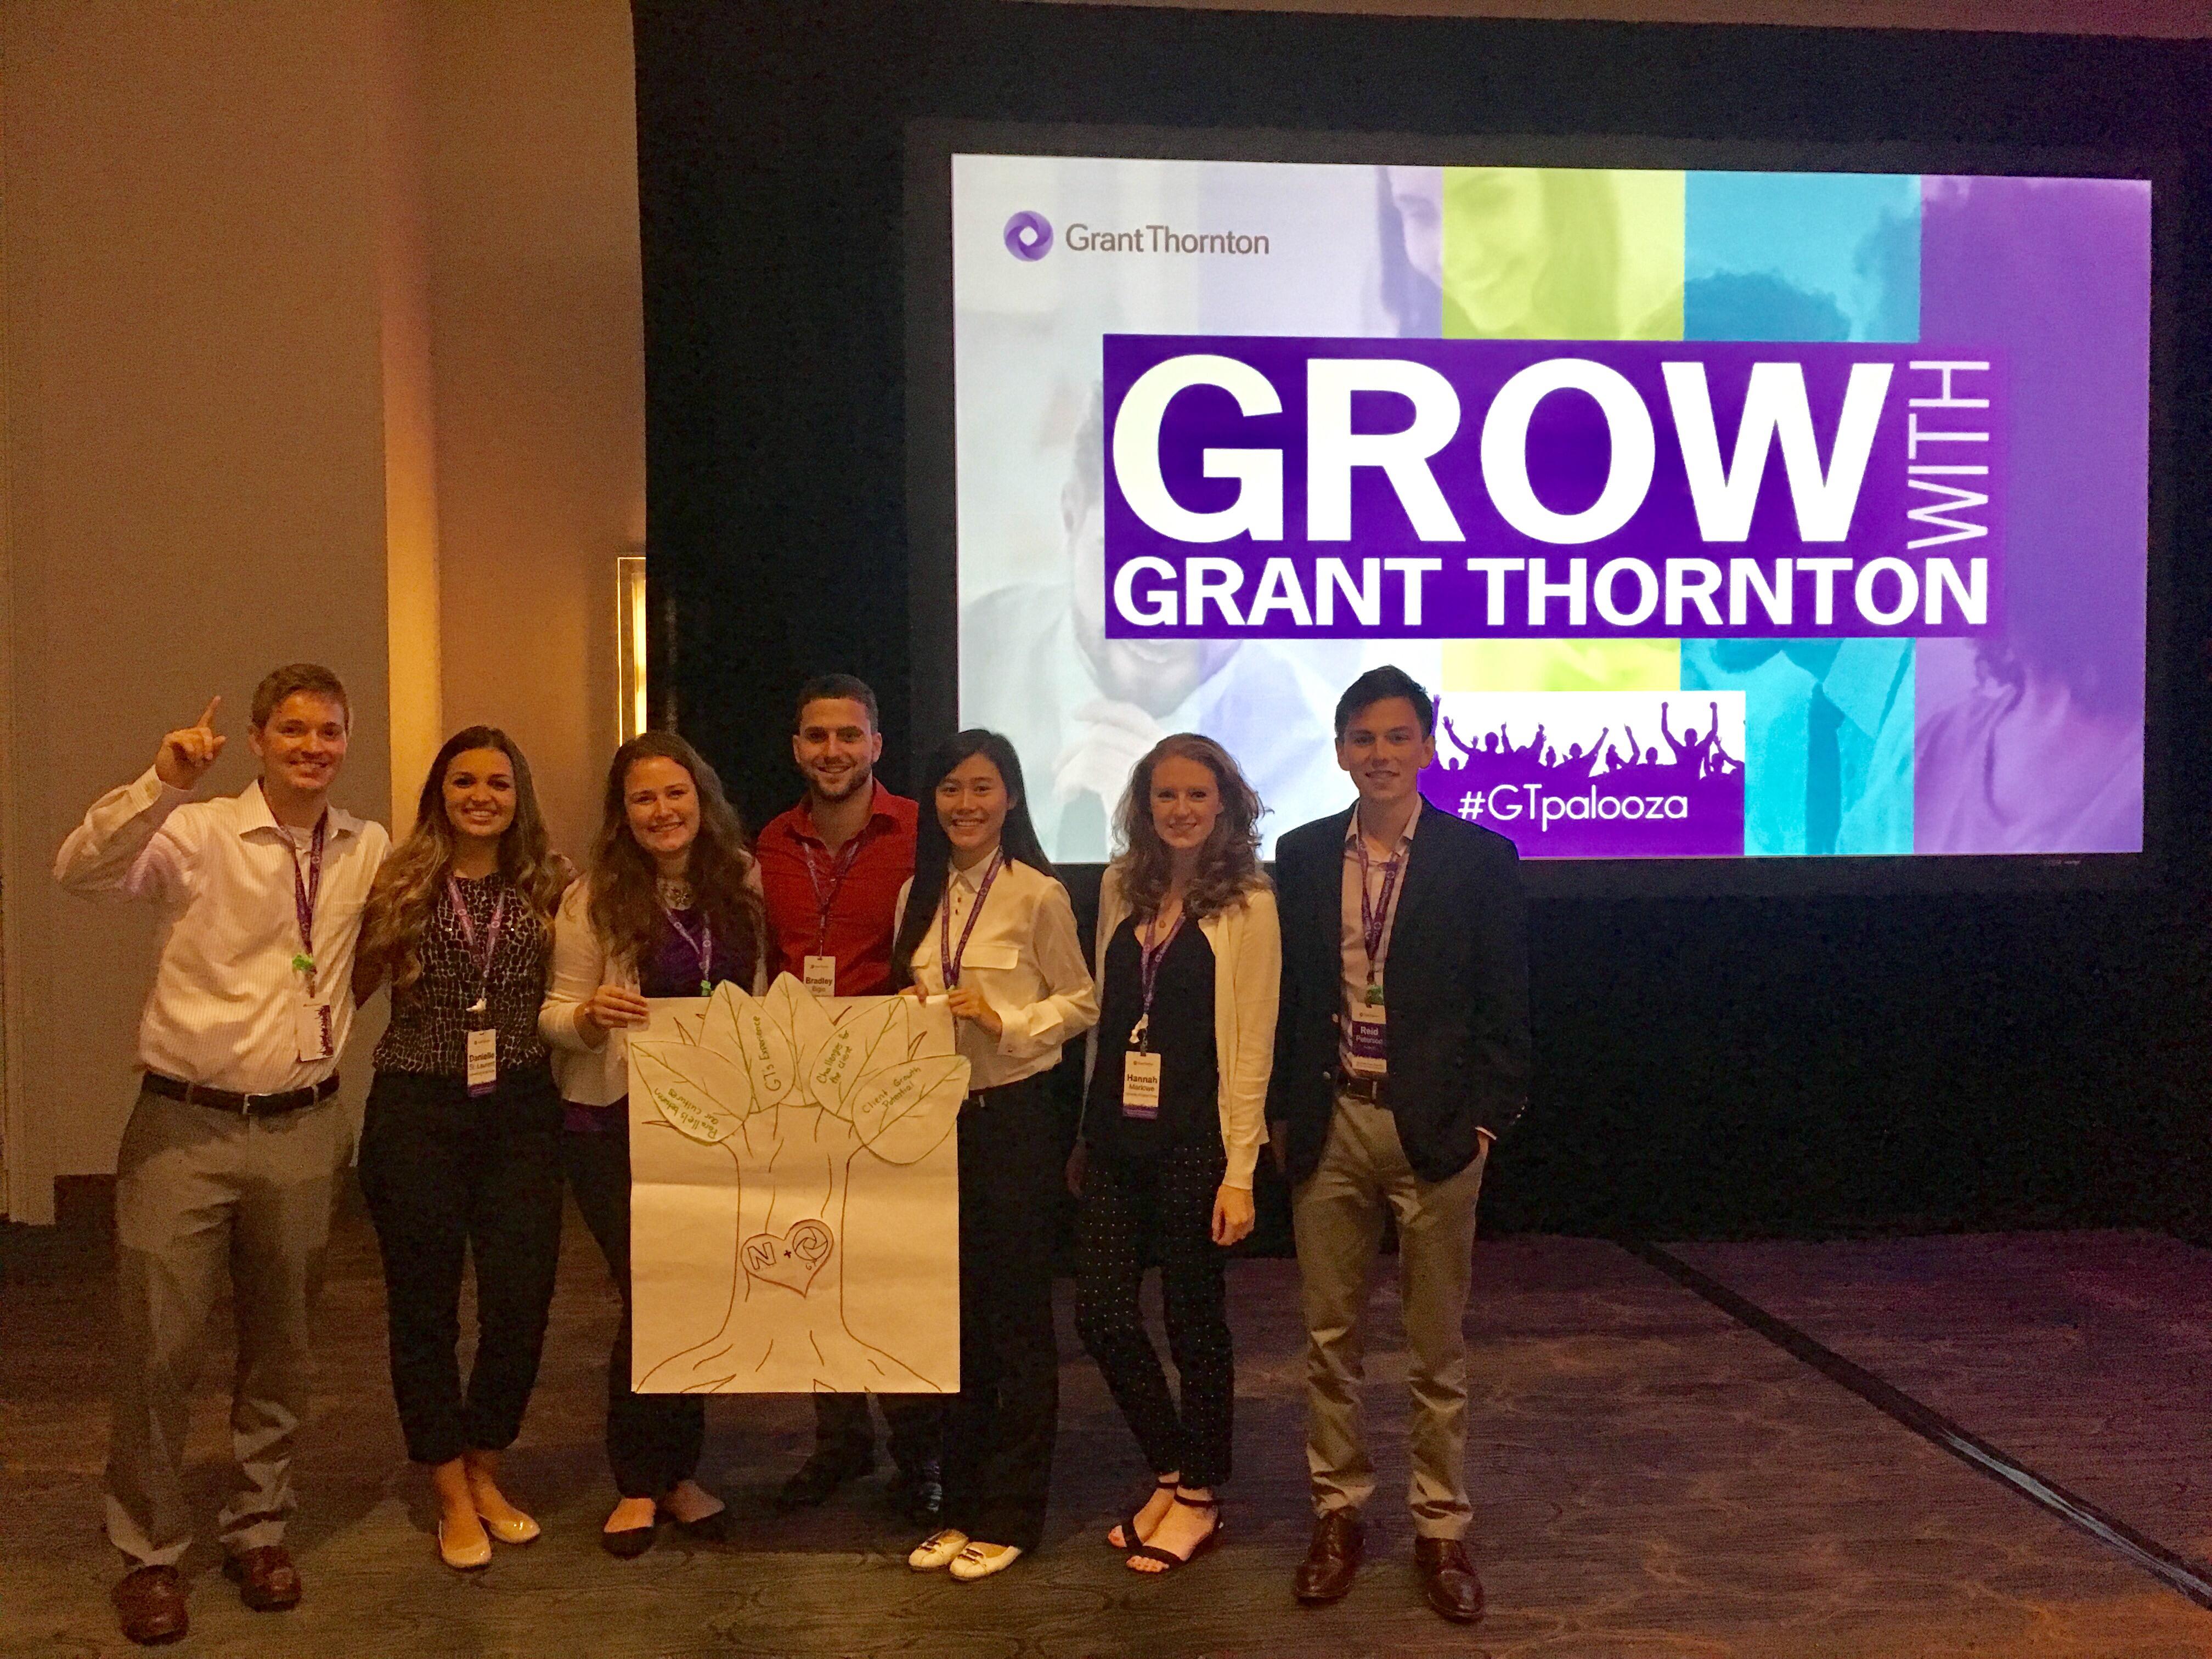
Later in the summer, all of the Grow with Grant Thornton participants from the eastern region came together in Fort Lauderdale, Florida for a three-day immersion into Grant Thornton. Here, we continued to learn about the culture and selected service line; I plan to go into the advisory service. Additionally, we were put into teams to compete in a case study competition. Each team was given the task of selecting a Russell 2000 company, and pitching this client to a panel or managers and partners. We were to explain what about this company would make it a great fit as a GT client, and why the company should want to work with us. My team selected Neenah Paper manufactures. Our presentation explained how Neenah was a growing company with much potential, what GT could offer the client, how GT was very experienced with manufacturing, and that our company cultures matched up well. Because of all of these reasons, we believed Neenah would be a great, dynamic client for Grant Thornton. I was very proud of our final presentation. Below is a picture of our team with our visuals from our pitch.
This conference has shown me than I am on the right career path. I am interesting in going into the Risk Advisory or Business Consulting and Technology practice of their Advisory service line. I would definitely love to work with Grant Thornton more in my future, but even if that is not possible, this firm has shown me what kind of work I should be doing long term, which I am grateful for.

IBIT Small Group Meeting with Walmart
In September 2016, I was fortunate to attend a small group lunch with Ban Hasan, the Chief Culture, Diversity and Inclusion Officer and the former Senior Vice President of Strategic Services at Walmart, and several other Walmart executives. This took place after an AIS Speaker Series meeting where we had the opportunity to hear Mr. Hasan talk about his journey to Walmart and experiences with IT. Hearing his story, having graduated from Temple himself, was very inspiring to me. In the small group meeting, we were able to talk about the internship opportunities Walmart offers and why the company would be a good fit for us. Having a background in fashion, retail being a huge part of that industry, I am particularly interested in going into retail data analytics. Walmart has been a leader in this field since it’s inception and I would love the opportunity to work with them and become more knowledgeable on this segment of the industry.

Data Analytics Challenge Project
For the Temple Data Analytics Challenge, myself and a team from my Data Science class decided to work on the AmerisourceBergen Challenge, focusing on how small business pharmacies can compete with the large national chains. This challenge gave me great insight on how data can be applied to find real solutions to real world problems, and improve businesses for everyone. Below is our final infographic. 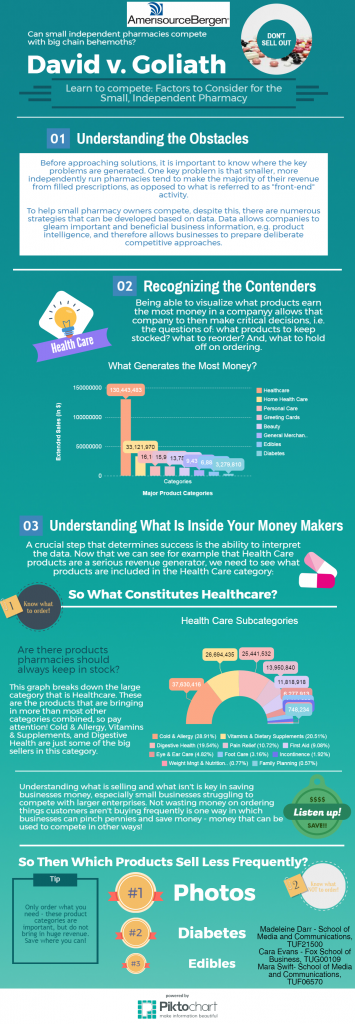
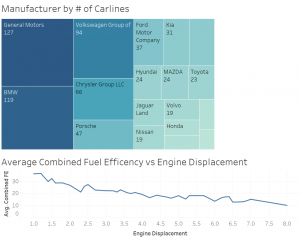
Tableau Project
This Tableau dashboard is a sample of some of the data visualizations I created using Tableau in my Data Science class. These graphics use a data set that includes a large variety of data on car brands and the attributes of those cars. These two visualizations are a tree graph showing the manufactures and their number of carlines, and the correlation between cars average combined fuel economy and their engine displacement.
EY Emerging Leaders Program Boot Camp Event
In February 2017, I was selected to attend the EY Emerging Leaders Program Boot Camp at EY’s  Philadelphia office. This event was an evening of mock interviews, resume preparation, and exploration of the service lines and internship opportunities offered at EY. I am honored to have been selected for this event and gained so much knowledge even in just one evening. I was specifically looking into EY’s Risk Advisory program, and was able to talk to some of their professionals currently working in this field. Learning about their experiences has helped me understand more about this practice and guided me to better understand what I want to do with my career.
Coursework
Many of the classes I have taken so far have already prepared me well for a career in IT.
At the Fashion Institute of Technology, I took a course on Excel for Business. This was an extremely thorough and in-depth course on the powerful tool of Microsoft Excel. After this class, I am able to say I am skilled in most essential aspects of Excel, including advanced formulas, tables and formatting, conditional formatting, pivot tables, macros, and data analysis. This has given me a good base knowledge for learning more advanced analytics tools, which will all be helpful in my future career.
At Temple, I have taken multiple courses specifically geared towards IT and data analytics. In the Fall 2016 semester, I took Data Science, a course focused on data visualization and analysis. In this course we learned the data visualization software Tableau. This tool is very popular in the industry and something I am excited to learn more about and hopefully use in my future. Here and here you can see examples of my projects from this course including visualizations I created for it on Tableau.
Currently, I am enrolled in Information Systems in Organizations. Already in the class we have learned many different tools and skills that will be useful in a career in IT. These include WordPress, Google Analytics, and SalesForce. We have also learned about the use of swimlane diagrams and ERDs for organizing the business process. All of these tools are the foundation of MIS and I am excited to build on to this platform in my future courses.
Data Science Analytics Project
Below is the final product of a group project I worked on in my Data Science class. We were looking into if there was a connection between state sex ed laws and their abortion rates. This project was very interesting and gave me a great look at how we can use data in our everyday lives. The visual below was created by myself.
