

Flash Research Assignment 4: WordPress
Flash Research Assignment 4: WordPress
Our company should implement the WordPress Platform. WordPress is the ability to reduce costs by headcount reduction. With the implementation of this technology, our company will see an net benefit of $2.451 Million.
The key benefit of this technology is its ability to increase efficiency. This technology comes from the usage of plug-ins, which are free or low-cost. With an increase in efficiency, we will be able to have a reduction in headcount. When we implement this technology, our personnel who work with WordPress, we will have a realized headcount reduction of 7 developers.
The headcount reduction from this cost avoidance strategy results the company with three-year benefits of $2.625 Million. Hardware, software, maintenance and training/productivity losses comprise the three-year costs of $174 thousand. We will realize a three-year net benefit of $2.451 Million.
Works Cited
Gillespie, Penny, Jason Daigler, and Mangus Revang. Market Guide for Digital Personalization Engines. Gartner, 7 Apr. 2015. Web.
@WordPressDotCom. “Marketing – Create Your Stunning Website.” WordPress.com. N.p., 2016. Web. 29 Nov. 2016.
Oni, Joseph. “5 Reasons You Might Not Want to Use WordPress.” Inspirationfeed. N.p., n.d. Web. 29 Nov. 2016.
| 12 | number of developers | |||
| 125000 | salary of developers | |||
| 0.75 | percent moved to WordPress | |||
| 0.778 | efficiency improvement | |||
| 100000 | hardware and software cost | |||
| 18000 | maintenance | |||
| 10000 | training and productivity loss per developer | |||
| 9 | Percent of word press* number of employees | |||
| 7 | Headcount reduction | |||
| 2 | efficiency improvement * A8 | |||
| Year 1 | Year 2 | Year 3 | ||
| Costs | ||||
| Hardware/ Software | 100000 | 100000 | ||
| Maintenance | 18000 | 18000 | 18000 | 54000 |
| Training/ Productivity loss | 20000 | 20000 | ||
| Total Costs | 138000 | 18000 | 18000 | 174000 |
| Year 1 | Year 2 | Year 3 | Total | |
| Benefits | ||||
| Headcount Reduction | 875000 | 875000 | 875000 | 2625000 |
| Total Benefits | 875000 | 875000 | 875000 | 2625000 |
| 3- Year Net Benefits | 737000 | 857000 | 857000 | 2451000 |
Flash Research Assignment 3: Microsoft SharePoint
Flash Research Assignment 3: Microsoft SharePoint
Our company should utilize Microsoft SharePoint immediately. SharePoint connects all users, employees or customers, through the same online platform to increase productivity. By implementing this technology, the PMPs will be able to increase their billable hours, and the company will see an overall net benefit of $1.8 million.
The key benefit of this technology is its ability to share documents between employees and clients. Users of SharePoint are now able to easily connect online from any device while using the password-protected platform in order to share project proposals, which will in turn cause them to spend less time managing documents. This sharing increases productivity and enables PMPs to increase their billable hours from 1,500 hours/year to 1,900 hours/year.
This cost avoidance strategy will allow our company a three-year benefit of $2.1 Million. The increased revenue will show a three-year net benefit of $1.8 Million. With the three-year implementation costs of $253 K, which stem from hardware, software and maintenance costs.
Works Cited
AIIM. “How Does SharePoint Work?” SharePoint- What Does That Mean? N.p., n.d. Web. 08 Nov. 2016.
Cirrus Tech Ltd. “Microsoft SharePoint Hosting, MS SharePoint.” MS SharePoint Hosting. N.p., 2015. Web. 08 Nov. 2016.
Emerson Network Power. “Unified Infrastructure.” Converged Infrastructure Solutions. N.p., n.d. Web. 08 Nov. 2016.
| Year 1 | Year 2 | Year 3 | Total | |
| Costs | ||||
| Hardware/ Software | $ 100,000.00 | $ – | $ – | $ 100,000.00 |
| Maintenance | $ 18,000.00 | $ 18,000.00 | $ 18,000.00 | $ 54,000.00 |
| 10% of one person | $ 33,250.00 | $ 33,250.00 | $ 33,250.00 | $ 99,750.00 |
| Total Costs | $ 151,250.00 | $ 51,250.00 | $ 51,250.00 | $ 253,750.00 |
| Year 1 | Year 2 | Year 3 | Total | |
| Benefits | ||||
| Increased Revenue | $ 700,000.00 | $ 700,000.00 | $ 700,000.00 | $ 2,100,000.00 |
| Total Benefits | $ 700,000.00 | $ 700,000.00 | $ 700,000.00 | $ 2,100,000.00 |
| 3- Year Net Benefits | $ 548,750.00 | $ 648,750.00 | $ 648,750.00 | $ 1,846,250.00 |
Flash Research Assignment 2: Server Consolidation: Cloud Computing and Virtualization
Server Consolidation: Cloud Computing and Virtualization
I would recommend that our company upgrades from physical, traditional servers to virtualized, Vmware servers during the next server refresh period. Our company will face 3-year net benefit of $9.2 million with this new technology. The main technological feature of virtualization is the ability to consolidate these servers.
The key benefit of virtualization is the ability to consolidate servers. This will “deliver IT services on demand, independent of hardware, operating systems, applications or infrastructure providers” (Server Consolidation, NP). Virtualization will take 80% of our current servers and convert them into VMware servers which take up one-tenth of our current physical space. Consolidating our servers creates a decrease of 800 to 280 physical servers.
Currently, over a three-year time span, it costs the company $14 million for our current servers, and this is the perfect time to invest in the new technology because we are doing our server refresh which will benefit the company $4.8 million. This cost avoidance strategy will create a net benefit of $9.2 million over a 3-year time period, through the usage of server consolidation.
| Current 3 Year Analysis: | ||||
| Before Virtualization/Cloud Computing: | Year 1 | Year 2 | Year 3 | 3-Year totals |
| Total number of Servers: | 1,000 | 1,000 | 1,000 | 1,000 |
| Cost of Server: | $8,000 | 0 | 0 | $8,000 |
| Cost to Run: | $2,000,000 | $2,000,000 | $2,000,000 | $6,000,000 |
| Total cost for Servers: | $10,000,000 | $2,000,000 | $2,000,000 | $14,000,000 |
| Proposed 3-Year Analysis: | ||||
| After Virtualization/Cloud Computing: | ||||
| 80% of Servers (Vmware): | 800 | 800 | 800 | |
| 20% of Servers (Traditional): | 200 | 200 | 200 | |
| Number of Potential Virtual Machines: | 80 | 80 | 80 | |
| Cost of Server: | $ 16,000 | 0 | 0 | |
| Cost to Run: | $ 3,000 | $ 3,000 | $ 3,000 | |
| Cost of 80% of Servers: | $ 1,280,000 | 0 | 0 | $1,280,000 |
| Additional Costs to run (80% of Servers): | $ 240,000 | $ 240,000 | $ 240,000 | $720,000 |
| Cost of 20% of Servers: | $ 1,600,000 | 0 | 0 | $1,600,000 |
| Additional Costs to run (20% of Servers): | $ 400,000 | $ 400,000 | $ 400,000 | $1,200,000 |
| Total cost for Servers: | $ 3,520,000 | $ 640,000 | $ 640,000 | $ 4,800,000 |
| Total Net Benefit: | ||||
| Benefits: | $6,480,000 | $1,360,000 | $1,360,000 | $9,200,000 |
Works cited
“Reduce IT Costs and Increase Control with Server Virtualization.” Server Virtualization & Consolidation. N.p., n.d. Web. 10 Oct. 2016.
“What Is Server Consolidation? – Definition from WhatIs.com.” SearchDataCenter. N.p., n.d. Web. 10 Oct. 2016.
“What Is Server Virtualization? – Definition from WhatIs.com.” SearchServerVirtualization. N.p., n.d. Web. 10 Oct. 2016.
Flash Research Assignment 1: The Implementation of a Vital Tier III Data Center
The Implementation of a Vital Tier III Data Center
Our company should upgrade from a Tier I Data Center to a Tier III Data Center. By making this change we will incur a 3-year implementation benefit of about $13,229,056. This new version of a data center introduces efficient components that work together to reduce downtime.
The current Tier I data center that we are running has 99.67% availability, while a Tier III datacenter has 99.98% availability. Our current Tier I Data Center faces an average of 1,734 minutes of downtime per year while the proposed Tier III Data Center costs the company an average of 105 minutes of downtime a year. The main difference between the two data centers besides time and money is redundancy. Redundancy is allows the system to increase reliability in terms of a backup. Another vital point is that in the Tier III Data Center allows for a decrease in downtime because even if one server is not working, the other server will, preventing excessive downtime, making it more accessible. Through the benefits of time, redundancy and protected maintenance periods, there is a significant reduction in overall downtime.
Over a 3-year period, our company will see a net benefit of $13,229,056. Additionally, the cost would amount to $35,000,000, while the benefit is $48,229,056. The net benefit is explain by diminishing the downtime to almost nothing, saving the company a large sum of money.
Works Cited
‘N+1 DATA CENTER REDUNDANCY’, Alex Carroll. “N 1 Data Center Redundancy | Lifeline Data Centers.” Lifeline Data Centers. N.p., 29 Mar. 2010.
“Understanding Tier 3 and Tier 4.” Tier 3/Tier 4: Datacentre Classification. N.p., n.d.
Figure 1
| Minutes in a Year | 525,600 | |||
| Cost per minute | 14,800.00 | |||
| Cost of Implementation | 35,000,000 | |||
| Tier I | Availability | 1-Availability | Time Down/ year | Cost per year |
| 99.67% | 0.0033 | 1,734.48 | 25,670,304.00 | |
| Tier III | Availability | 1-Availability | Time Down/ year | Cost per year |
| 99.98% | 0.0002 | 105.12 | 1,555,776.00 | |
| 0.31% | 0.0031 | 1,629.36 | 24,114,528.00 | |
| Year 1 | Year 2 | Year 3 | Total | |
| Costs | 35,000,000 | 0 | 0 | 35,000,000.00 |
| Benefits | 0 | 24,114,528.00 | 24,114,528.00 | 48,229,056.00 |
| 3-year net benefits | 13,229,056.00 |
Temple University Data Analytics Finalist Panel
To read more about how this event impacted me and to see my involvement, click here!
The Temple University Data Analytics Finalist Panel, was a really cool and interesting event that was amazing to be a part of. This event included a panel of industry leading judges, including the former CIO of Cigna, and other employers from Alexion, Amerisourcebergen, Merck and Walmart who viewed the various student-created inforgraphic. My team as well as 19 others (out of 187 teams and over 400 entrants) got the opportunity to present for 4 minutes about our project. This event showed me how to work well with a team while creating a product and presenting that product.
Our infographic:
temple-data-analytics-challenge-2016-infographic
The IT Awards
Last spring, I attended the IT awards ceremony for the MIS program within the Fox School of Business. This ceremony awarded top MIS students awards based on specific achievements that were made. It also honored one Professor. This event had speakers from the professional field, such as the retired CIO of Cigna. In the future, it would be an honor to be awarded something at an event like this one!
MIS/ CIS Projects
To view which MIS and CIS courses I have taken, click here.
I have worked on many MIS and CIS related projects while at Temple, but here are some of my favorites:
Website Designing:
You can access my website by clicking here!
While in Cyberspace & Society (CIS835), we created websites. These websites were required to include many different components. This project taught me how to use Adobe Dreamweaver. This is one of the first ever projects that I completed (and it was done before I knew how to code!), and it inspired me to become an MIS major. This website is very raw, and it shows where I started and it shows my potential for the future.
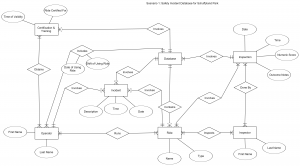
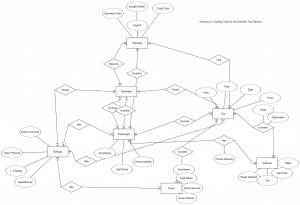
ERD Diagram Mapping:
While I took Data Analytics (MIS 2502), I learned how to create advanced Entity-Relationship Diagrams. These are process maps that allows the viewer to understand a story minimal words and an easy to follow and understand diagram. Through this project, I was able to learn how to visualize information, which could help me in the field of IT Audit.
Some example diagrams that I created for this class:
Temple University Data Analytics Challenge:
While taking Info Systems Organizations (MIS 2101), one of our assignments was to enter into the Temple Data Analytics Challenge. The goal of this case was to create an infographic from raw data and turn that into a visual representation, while suggesting solutions to an important corporate issue. This challenge showed me real world experience, and it showed me how to visualize and explain data in an eye-catching way. I entered this challenge in 2015 and 2016. I was a finalist in 2016.
Temple Data Analytics Challenge 2015:
Temple Data Analytics Challenge 2016:
temple-data-analytics-challenge-2016-infographic
Coursework and Career Interests
If you would like to view my coursework, click here.
I have a strong educational background in MIS. This shows through the various course that I have taken within the MIS program at Temple University. When I finish college I would like to work as a data/ business analyst or an IT auditor. Through the Data Analytics (MIS 2502) course, I learned skills such as how to write SQL, how to use R and Rstudio, and I also learned advanced excel skills. In my previous internships, I used my excel skills in order to succeed in my position. I continued my usage of SQL and interest in analytics and databases when I took Data Centric App Development (MIS 3501). This course showed me how to use SQL in order to create a webpage that integrated php and PDO coding with the usage of a database webpage. These skills help me be organized and will help me succeed as a data analyst.
Technological Advances through the Internet of Things
The Internet of Things (IoT) has become prevalent within the last 20 to 30 years because of the high degree of technological advances. In order to connect physical devices, like automobiles and buildings, with humans by embedding or creating unique identities to enable data collection or transfer over networks, the Internet of Things was created. The IoT is an extremely broad topic that relates to many parts of the technology revolution as a whole.
With advancements such as a decrease in the cost of data storage and the exponential growth of the internet, the rise of the IoT has been extremely influential in the realm of data analytics. Many areas of data analytics are involved in the IoT, such as R. The IoT is all about taking data that has been collected through devices, the internet and any other medium and making decisions relating to that data. For example, decision trees in R take data that has been collected through the IoT and uses the data to create decisions.
In other places in the world, the significant growth of the IoT has become the norm. Since the inception of the IoT, many people have become reliant on this new technology for aspects of their life. Amazon is a big player in the world of the IoT. Amazon’s Alexa is coming forward as a product that can be used with data over a network. Alexa is a device that similar to Apple’s Siri has been able to transform how data is used through the IoT and through Artificial Intelligence. A user can ask the device to play music, add something to the shopping list or even hold a conversation about the weather. With the inclusion of products like Alexa, the IoT is able to grow at extreme rates showing a colossal importance in the world of technological advancements.
Works Cited
“What Is Internet of Things (IoT)?” IoT Agenda. N.p., June 2014. Web. 21 Apr. 2016.
Rodriguez, Jesus. “Is Amazon Echo the next Enterprise IoT Platform?” CIO. N.p., 2016. Web. 21 Apr. 2016.
Welcome to my website!
My career goals and aspirations are based upon the MIS field of study and what it has to offer. I prefer the business side of IT, so I would like to be a business analyst or an IT auditor. I have had two internships at the same company, and I plan on continuing my internship experience this summer at a new company! You can view my work experience here.
Personally, I have a love and passion for travel and new cultures. I can speak Spanish conversationally, and I also participated in an exchange program while in high school. I have also been to 3 other countries this year: Israel, Canada and the Bahamas, as well as countless states across every region of the United States!
You can view my resume here and my coursework here!
I love being a student here at Temple and I am extremely passionate about the Temple Owls and their sports teams!
Last updated: 11/29/16