

Autodesk Internship Spring 2020
![]()
Autodesk Internship Spring 2020
For spring 2020, I continued my work as an Event Analytics & Project Management Intern at Autodesk, a leading software company in the Bay Area.
Company Overview
Autodesk, Inc was founded in 1982 by John Walker and Dan Drake, two people with the ultimate goal of transforming the Architecture, Engineering, and Construction (AEC) industry. Although headquartered in San Rafael, CA, Autodesk has offices in other locations such as San Francisco, Montreal, Boston, etc. and even overseas in India, Singapore. The company has more than 10,000 employees worldwide and is known as “The Make Company”: when you want to search something, you rely on Google; when you want to buy something, Amazon is the choice; and when you want to make something, you go to Autodesk.
Many people, including myself, got to know Autodesk because of its flagship product AutoCAD and other offerings within the AEC space. However, it was until researching for my interview with the company that I know about the other key areas that the company competes in: Product Design & Manufacturing, and Media & Entertainment. Overall, the product portfolio at Autodesk is HUGE.
Organization & Department Overview
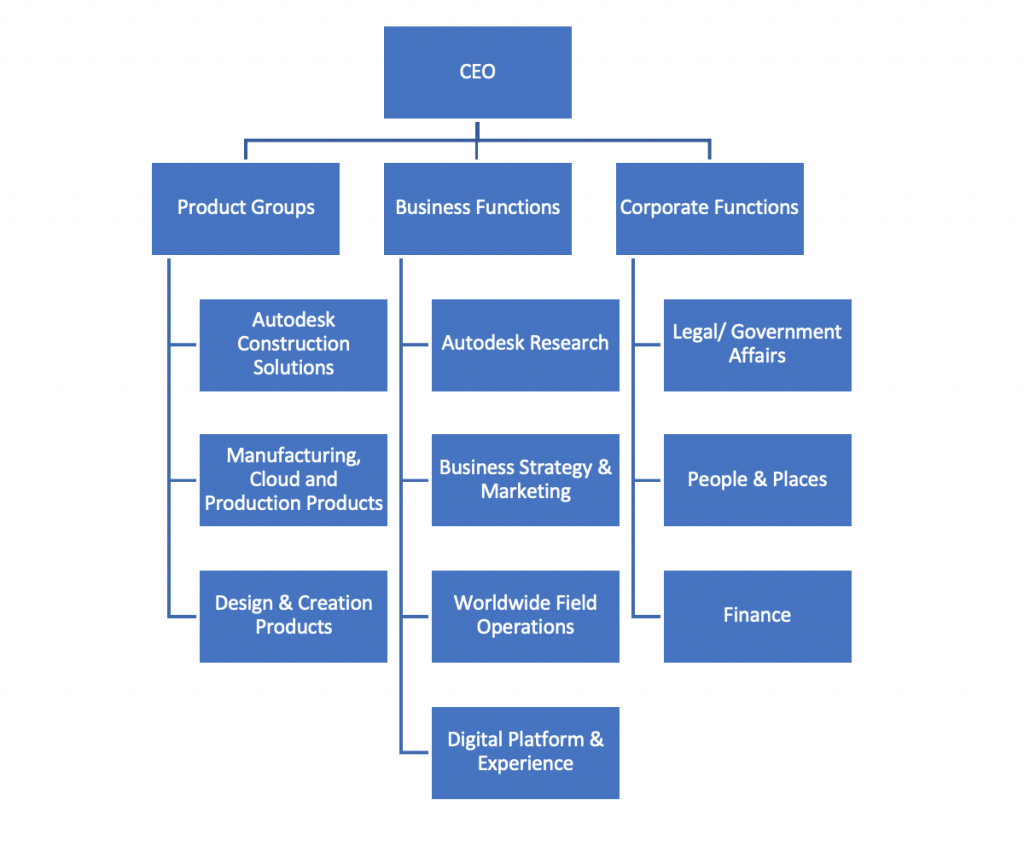
Autodesk has three main groups/functions: Product Groups, Business Functions, and Corporate Functions. My internship falls within Business Strategy & Marketing within Business Functions. Specifically, I’m working under Global Demand Generations in the Global Customer Events team.
My Internship
This time at Autodesk, I took on three projects:
Deliver AU Dashboard
I set to develop a customized dashboard targeting stakeholders of Autodesk University London. I first tackled this problem by conducting interviews with different stakeholders to identify critical metrics and KPIs that need to be communicated. Then I collaborated with Marketing Operations & Technology team (MOT) to code automation scripts to get data out of our event conference management tool API and ingest this data into Power BI for visualization. The scripts are scheduled to run on a daily basis so that the dashboard stay up-to-date with any additional information. I also conducted user testing to ensure that the metrics presented were of stakeholders’ greatest interests.
Migrate AU Las Vegas Dashboard
Last fall, I helped the team deploy a set of dashboards that communicates critical metrics of Autodesk University Las Vegas to 200+ stakeholders. This semester, I collaborated with the MOT team to migrate those dashboards, which were built locally on a cloud PC, to Autodesk’s internal marketing intelligence platform, with the goal of bringing centralized data to Autodesk’s employees. I also continued to interview those stakeholders to understand their needs for optimization, conducted analysis on data coming from various sources to ensure accuracy as well as integrity, and fixed the dashboards based on the information gathered.
TurnoutNow Dashboard
I’m also in the progress of migrating the TurnoutNow Dashboard, which keeps track of on-site engagement, onto Autodesk’s centralized platform.
How does the MIS Program prepare me for this internship:
- Data Science: Since my internship involves dealing with data coming from APIs, it is important to know the ETL process, as well as techniques to model the data. The data visualization skills gained from this class also allow me to design dashboards that satisfy the requirements of the users.
- Project Management: This semester, my projects didn’t involve coding like last semester but instead, required a lot of cross-functional collaboration. Therefore, meeting and schedule management skills came in pretty useful.
- Data Analytics: The ability to program in R is valuable as I need to use it pretty often to create graphs for my dashboards.
Lessons Learned:
- Communication, Time Management & Organization: With full ownership of this project, I managed my own timeline and deliverables, but at the same time, I needed to stay communicative with stakeholders to ensure they know about the dashboard and its impact.
- Proactivity: As the only technical person within my team, there were times that I got stuck with a piece of code or didn’t know if my analysis was right. Thus, I had to actively meet with data analysts and engineers from other departments and asked them questions to help me move forward.